Remote observations show patterns, while practical decisions depend on explaining what those patterns could mean. Interpretation therefore requires more than locating a high or low value on a map. A useful analysis considers the timing of the observation, the physical processes that influence the measurement, and the information available from complementary sources. This perspective separates an observed signal from a proposed explanation and from an action recommended to a user. Keeping those stages distinct makes it easier to investigate alternative causes, communicate ambiguity, and choose a proportionate next step.
This working guide considers keeping earth observation data usable over time across sediment-runoff catchments. The immediate decision is to connect sampling priorities across land and water. Useful reference evidence includes timed water samples, runoff context and land-cover observations. The case is an illustrative planning context, with assumptions to check against the actual sensor, landscape and project requirements.
The setting: Sediment-runoff catchments
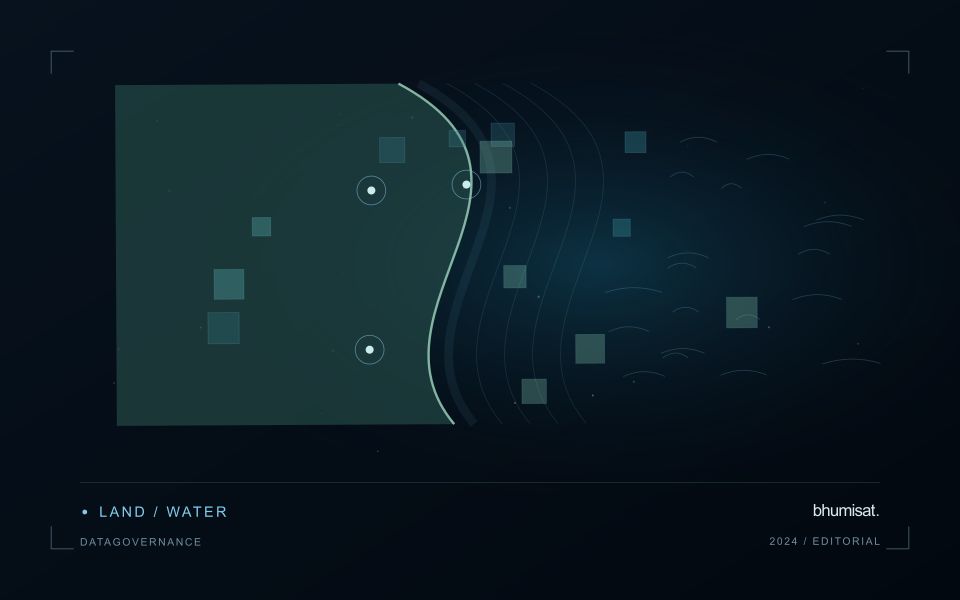
A catchment monitoring project connects land-cover patterns, drainage pathways and observations of receiving waters. These evidence streams operate at different spatial and temporal scales. A bare land patch or a bright water plume may be relevant to a sampling question, but an image alone does not establish that one caused the other. Define whether the task is mapping potential source areas, tracking a visible water pattern or evaluating a particular sediment-related variable.
Maintain suitable land and water masks and compare acquisitions with their rainfall and flow context where that information is available. Clouds can obscure the period of greatest interest, and conditions may change rapidly after runoff events. Land adjacency, shallow water and surface reflections can also affect optical interpretation. A useful monitoring record identifies the dates and valid areas supporting each observation instead of presenting a continuous causal story across missing measurements.
Field validation should collect water measurements with clear location, timing and sampling methods, alongside the evidence used to describe land conditions. Sampling only the most obvious plume may overlook other parts of the response or ordinary background variation. More specific source attribution needs an investigation designed for that claim. A practical first product can organise catchment observations and prioritise coordinated sampling, while keeping remotely observed associations distinct from explanations established through additional measurements.
Define the responsibilities around the files
Data governance is the set of practical decisions that makes an archive trustworthy and usable. It covers who can publish a product, who maintains its description, how corrections are approved and how users discover changes. These responsibilities matter even for a small project. Without them, an attractive map may become detached from its source scenes, processing method and known limitations.
Assign stable identifiers to datasets and distinguish a collection from its individual files. Record the producer, contact route, geographic extent, time coverage, coordinate reference system, units and missing value conventions. Describe the processing level and whether the values represent measurements, corrected observations or model estimates. A clear data dictionary is especially important when a compact code or numeric flag carries a meaning that would otherwise remain implicit.
Preserve context as products evolve
Maintain provenance from source acquisition through processing and publication. Preserve source identifiers, algorithm versions, parameter settings and links to validation material. When a correction changes values, create a traceable version rather than silently replacing a file and leaving its description untouched. Explain the reason for the revision and whether earlier analyses should be revisited. Checksums help detect changes or corruption but cannot establish that a scientific interpretation is correct.
Access rules should reflect the actual data and agreements involved. Public satellite imagery does not automatically make every associated field record or derived dataset unrestricted. Location records may reveal sensitive ecological sites, and field photographs may include identifiable people. Review the relevant terms before combining or distributing sources, and express reuse conditions in plain language with a suitable license where appropriate. Preserve acknowledgement and citation requirements alongside the data.
Plan retention, backups and recovery before storage becomes crowded. Keep essential documentation and reproducible processing materials with the deliverable, while identifying intermediate files that can be regenerated. Test that a restored copy opens correctly and has the expected metadata. A release checklist should include file integrity, machine readable metadata, readable documentation and a useful contact path. Periodic stewardship reviews can detect broken links, obsolete formats and orphaned responsibilities. The aim is a product that remains interpretable after the original analyst has moved on.
Maintain the geographic units of analysis
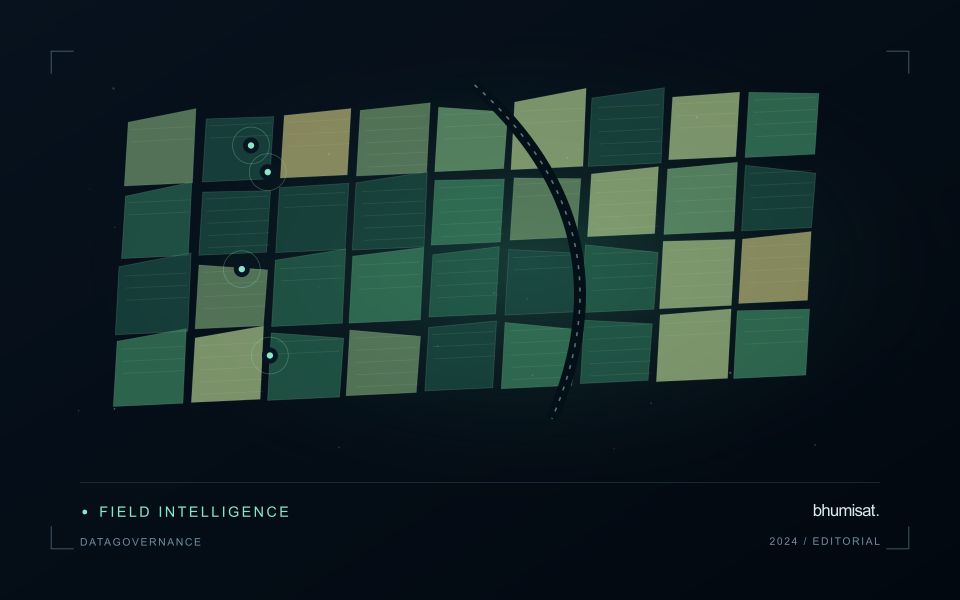
Many observation services summarise measurements within a field, management block, catchment, forest unit, or other mapped boundary. The meaning of that summary depends on whether the boundary accurately represents the unit being discussed. Start with a clear source for the geometry and record its date, coordinate reference, and intended use. A boundary drawn for visual orientation may require additional checking before it becomes a measurement unit.
Inspect overlaps, gaps, narrow fragments, and features that may have changed since mapping. A geometrically valid polygon can still describe an outdated operational unit. Ask the responsible team how divisions, mergers, new infrastructure, and management changes are recorded. Where pixels or reference measurements cross a boundary, define how they are assigned or excluded so that results remain comparable between analysts and processing runs.
Version the boundaries alongside the observations. If a unit changes, preserve a relationship between the previous and revised geometry rather than replacing the history without explanation. Comparisons through time should identify whether they use a constant spatial unit or the operational units valid at each date. This makes it easier to distinguish a change in the measured surface from a change introduced by the geography used to summarise it.
Check spatial alignment before comparison
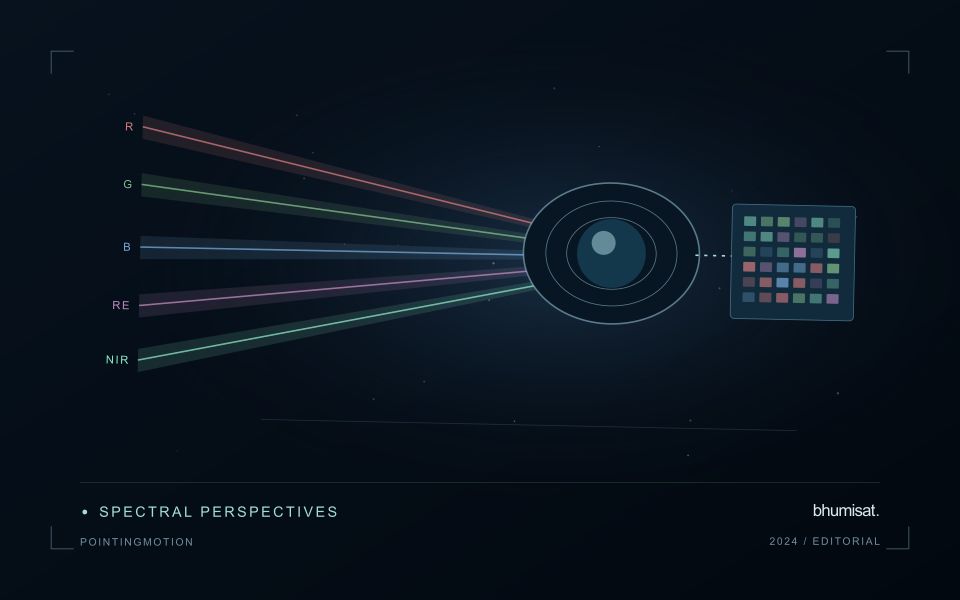
A comparison between images, channels, maps, or field measurements assumes that the observations refer to the same locations at a suitable level of precision. Small alignment errors can become especially important near boundaries or narrow features. Before interpreting differences, inspect whether identifiable, stable features agree between the sources. A common coordinate reference is necessary for many workflows, but it does not by itself demonstrate accurate alignment.
Use control features that are appropriate for the observation scale and remain stable across the comparison period. Evaluate alignment in more than one part of the area, because a single location cannot reveal spatially varying distortion. Record the method used to estimate any correction and retain independent features for checking the corrected result. Where surfaces have genuinely changed, avoid using those changes as evidence of an alignment error.
Propagate the implications of remaining misalignment into the analysis. A workflow may exclude boundary pixels, summarise at a broader scale, or qualify interpretations for small features. The choice should follow the application rather than a preference for visually smooth output. Preserve both the original and corrected geographic references, and document resampling decisions so that future users can understand how measurements were moved onto a common spatial framework.
Bring the evidence back to the decision
A strong interpretation states what was observed, which explanations remain plausible, and what additional evidence would help distinguish them. Avoid presenting a convenient label as a confirmed cause when the measurements support only a broader pattern. Connect the proposed next step to the significance of the decision and the confidence available. This creates an interpretation that a field team, analyst, or project partner can examine, challenge, and improve as further observations become available.
Sources & further reading
Explore the bhumisat spacecraft concept and our vision towards 2030, or return to the journal.