A method that produces a plausible result has not automatically demonstrated that it works for its intended users. Validation requires a defined question, suitable reference evidence, and an evaluation design that reflects how the method will be used. This perspective examines which observations should be compared, how they should be sampled, and which errors matter in practice. It also considers the difference between evidence used to develop a method and evidence reserved for evaluating it. The objective is a test that can reveal weaknesses as well as confirm useful performance.
This working guide considers designing reproducible cloud processing workflows across wheat growing areas. The immediate decision is to review fields with unusual seasonal timing. Useful reference evidence includes sowing dates, crop stage and representative field observations. The case is an illustrative planning context, with assumptions to check against the actual sensor, landscape and project requirements.
Move the computation with a clear plan
Cloud processing can place analysis near a large satellite archive and reduce repeated transfers to a local computer. Its value depends on the workload. A small study may be easier to complete with a few downloaded scenes, while a continental time series benefits from selective reads and distributed processing. Begin with the geographic extent, dates, variables and output resolution that the analysis actually needs.
Inspect the storage format before choosing an execution pattern. Tiled imagery can support reading only intersecting blocks, and chunked multidimensional arrays can support selected time and spatial slices. These benefits depend on how data are organized and how the reader accesses them. Repeatedly opening complete remote files for tiny requests can waste time and bandwidth. Match processing chunks to source layout where practical, and avoid creating more small tasks than the scheduler can manage efficiently.
Make each run explainable and recoverable
Keep source identifiers, processing versions, input checksums where available, parameters and software dependencies with the workflow. Explicitly record projections, resampling methods, scale factors, masks and time aggregation rules. An output filename alone cannot capture these decisions. A small manifest linking inputs to outputs is useful when an archive is reprocessed or a result must be reproduced months later.
Develop on a representative subset that includes awkward cases such as missing bands, empty intersections and scenes with extensive cloud. Check numerical results and output metadata before expanding the workload. Design individual tasks so they can safely restart without duplicating completed results. Write intermediate output to a temporary location, verify it, and only then mark the task complete. Retain useful logs without recording access credentials.
Estimate storage, compute and data transfer costs together. Compression, unnecessary copies and repeated intermediate materialization can change the budget substantially. Monitor resource use during a pilot run and establish sensible limits before launching a large batch. Permissions should give each process the access it needs, and credentials should come from an appropriate secure mechanism. Finally, export an accessible result with provenance and quality information. A fast calculation becomes useful science only when another person can understand and inspect what was produced.
The setting: Wheat growing areas
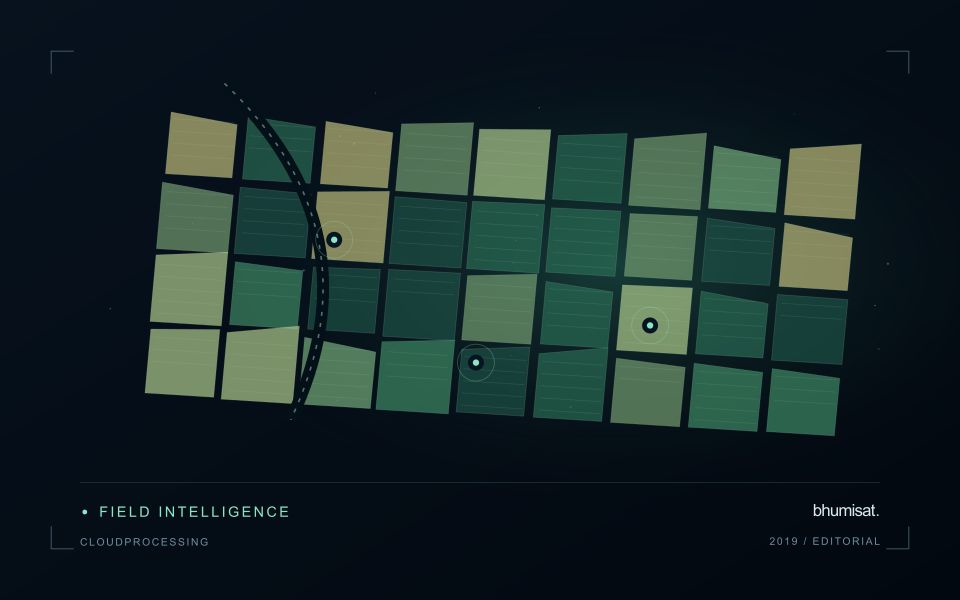
A wheat monitoring programme should begin with a clear description of its production setting. Sowing windows, variety choices, water supply and management practices can vary across a region. Fields at different developmental stages should not be judged against a single image threshold as though they followed one uniform calendar. A useful field register combines boundaries with sowing information and a record of the operations that can influence the observed canopy through the season.
Repeated observations can help describe the timing and spatial consistency of crop development. Inspect the quality of each acquisition and distinguish persistent patterns from a single questionable measurement. Field margins, tracks, bare patches and neighbouring crops can affect irregular or narrow units. Where comparisons involve different image products, make sure the processing and spatial support are suitable before interpreting a numerical difference as a crop response.
The field investigation should follow a defined question, such as whether a section has uneven establishment or a different development stage from its peers. Record the evidence used to resolve that question, including places where the image alert did not correspond to an actionable condition. If a model estimates harvest outcomes, evaluate it against appropriate production records and separate training from assessment. The reporting system should communicate uncertainty alongside the spatial pattern that prompted attention.
Establish a metadata contract
Define a small set of metadata that every observation and derived product must carry through the workflow. Useful fields include a stable identifier, acquisition time, geographic reference, spatial coverage, measurement units, source version, and processing status. The purpose is not to collect every possible detail. It is to preserve the information required to interpret, compare, locate, and reproduce the observations that the application depends on.
Specify field names, allowed formats, and the meaning of missing values. A blank field, a value of zero, and a measurement below a detection threshold are different states and should remain distinguishable. Time zones, coordinate order, and unit conversions deserve particular attention because inconsistent conventions can produce plausible-looking results that are difficult to diagnose. Validate the metadata when information enters the system, while the source and collection context remain available.
Treat the metadata contract as part of the delivery interface. A product passed to another team should retain the identifiers needed to trace its source and processing history. If a transformation changes the meaning of a field, create a new field or document the change rather than reusing the original name silently. A clear contract reduces ambiguity between field collectors, analysts, software components, and the eventual users of the information.
Deliver quality flags that users can interpret
Quality information should describe the condition of an observation in terms that remain useful through the workflow. A single valid or invalid label may be sufficient for some calculations, but operational users often need to know why an observation was qualified. Distinguish acquisition limitations, processing failures, uncertain reference matches, and conditions that make interpretation ambiguous. These categories point towards different responses and should not be merged without a clear purpose.
Define a small, documented set of flags with stable meanings. Record whether a flag applies to a complete scene, a geographic unit, an individual measurement, or a derived result. A unit containing a mixture of qualified and unqualified observations may also require a coverage measure. Include the rule used to combine flags when summarising data so that a favourable average does not conceal a substantial fraction of unusable input.
Test the flags with the people receiving the product. Ask what they would do differently for each state and whether the terminology supports that choice. Keep the original flags available even if the interface presents a simpler summary. When flag definitions change, version the rules and review their effects on historical comparisons. Useful quality communication makes the condition of the evidence visible at the moment when a user decides how much confidence to place in the result.
Bring the evidence back to the decision
The validation record should explain the population represented by the test, the reference observations used, and the limitations of the comparison. Report meaningful errors alongside useful successes, and retain examples that challenge the method. Treat wider deployment as a new opportunity to evaluate transfer across relevant conditions. A well-designed validation programme gives users a defensible basis for deciding where the method is useful, where additional evidence is needed, and where another approach may be appropriate.
Sources & further reading
Explore the bhumisat spacecraft concept and our vision towards 2030, or return to the journal.