A convincing image can still contain measurements that are unsuitable for a particular task. Quality control asks whether the inputs, transformations, and outputs meet the requirements of the intended application. This perspective follows evidence through the workflow, from acquisition metadata and reference observations to the final interpretation. It encourages teams to define acceptance conditions before seeing the result, rather than adjusting them to favour a preferred conclusion. The purpose is a repeatable way to distinguish usable observations, observations requiring qualification, and observations that should be excluded from a decision.
This working guide considers designing reproducible cloud processing workflows in vineyard production parcels. The immediate decision is to prioritise vineyard zone inspections. Useful reference evidence includes vine growth stage, row management and sampling locations. The case is an illustrative planning context, with assumptions to check against the actual sensor, landscape and project requirements.
The setting: Vineyard production parcels
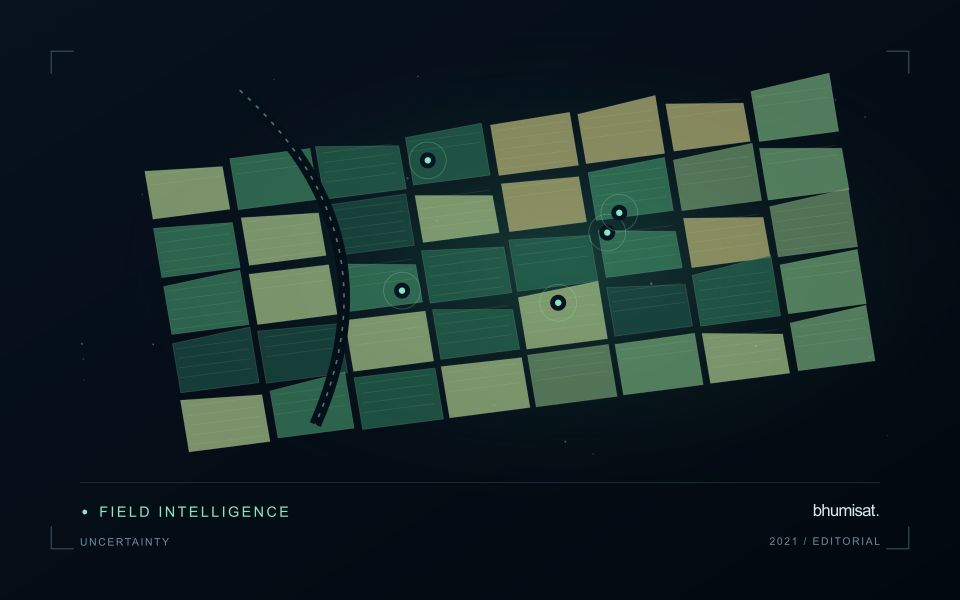
Vineyard imagery combines vine rows with inter-row vegetation, exposed soil, tracks and sometimes steep terrain. Row direction, canopy training and management can substantially influence the observed pattern. The relevant unit may be a parcel, a management zone or a sampled part of a row, and these units should be defined before analysis begins. A map with many small coloured areas does not necessarily provide measurements at the scale of an individual vine.
Build comparisons around growth stage and known operations such as canopy management or changes in inter-row cover. Inspect terrain-related illumination and geometric alignment where slopes or narrow parcels make these effects important. Record the proportion of valid observations used to describe each zone. When integrating drone and satellite imagery, consider their different acquisition times and spatial support rather than assuming that agreement should occur at every displayed pixel.
Field sampling should represent the range of mapped zones and include locations that appear ordinary. Record vine stage, management context and the precise area represented by each measurement. Relationships with fruit characteristics or production need reference observations that address those outcomes directly. A useful operational product can begin as a consistent zoning and inspection workflow, with stronger agronomic interpretations introduced only after the relationship between the image pattern and the field evidence has been evaluated.
Move the computation with a clear plan
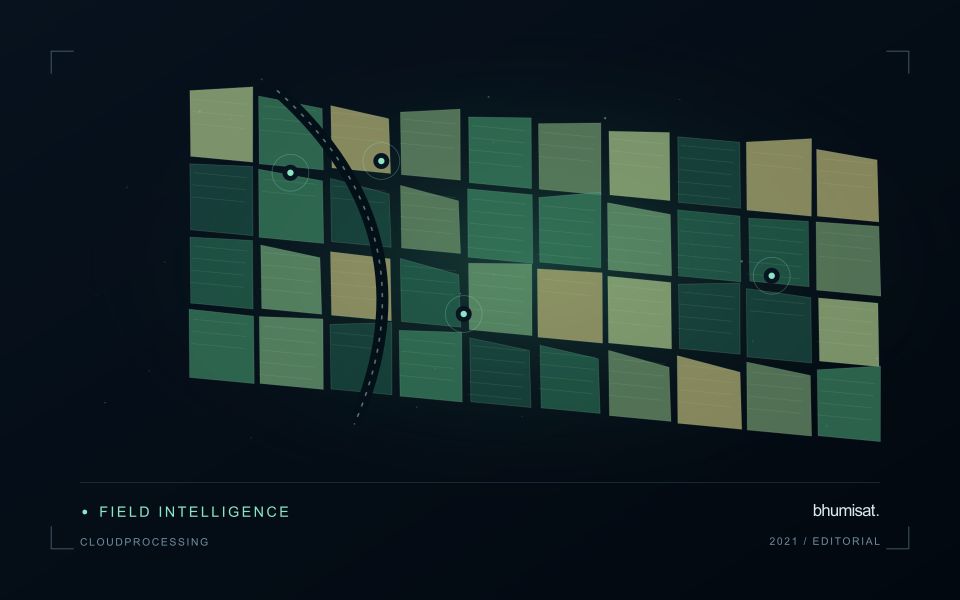
Cloud processing can place analysis near a large satellite archive and reduce repeated transfers to a local computer. Its value depends on the workload. A small study may be easier to complete with a few downloaded scenes, while a continental time series benefits from selective reads and distributed processing. Begin with the geographic extent, dates, variables and output resolution that the analysis actually needs.
Inspect the storage format before choosing an execution pattern. Tiled imagery can support reading only intersecting blocks, and chunked multidimensional arrays can support selected time and spatial slices. These benefits depend on how data are organized and how the reader accesses them. Repeatedly opening complete remote files for tiny requests can waste time and bandwidth. Match processing chunks to source layout where practical, and avoid creating more small tasks than the scheduler can manage efficiently.
Make each run explainable and recoverable
Keep source identifiers, processing versions, input checksums where available, parameters and software dependencies with the workflow. Explicitly record projections, resampling methods, scale factors, masks and time aggregation rules. An output filename alone cannot capture these decisions. A small manifest linking inputs to outputs is useful when an archive is reprocessed or a result must be reproduced months later.
Develop on a representative subset that includes awkward cases such as missing bands, empty intersections and scenes with extensive cloud. Check numerical results and output metadata before expanding the workload. Design individual tasks so they can safely restart without duplicating completed results. Write intermediate output to a temporary location, verify it, and only then mark the task complete. Retain useful logs without recording access credentials.
Estimate storage, compute and data transfer costs together. Compression, unnecessary copies and repeated intermediate materialization can change the budget substantially. Monitor resource use during a pilot run and establish sensible limits before launching a large batch. Permissions should give each process the access it needs, and credentials should come from an appropriate secure mechanism. Finally, export an accessible result with provenance and quality information. A fast calculation becomes useful science only when another person can understand and inspect what was produced.
Establish a metadata contract
Define a small set of metadata that every observation and derived product must carry through the workflow. Useful fields include a stable identifier, acquisition time, geographic reference, spatial coverage, measurement units, source version, and processing status. The purpose is not to collect every possible detail. It is to preserve the information required to interpret, compare, locate, and reproduce the observations that the application depends on.
Specify field names, allowed formats, and the meaning of missing values. A blank field, a value of zero, and a measurement below a detection threshold are different states and should remain distinguishable. Time zones, coordinate order, and unit conversions deserve particular attention because inconsistent conventions can produce plausible-looking results that are difficult to diagnose. Validate the metadata when information enters the system, while the source and collection context remain available.
Treat the metadata contract as part of the delivery interface. A product passed to another team should retain the identifiers needed to trace its source and processing history. If a transformation changes the meaning of a field, create a new field or document the change rather than reusing the original name silently. A clear contract reduces ambiguity between field collectors, analysts, software components, and the eventual users of the information.
Represent gaps without inventing observations
A monitoring sequence often contains periods without a usable observation. The reason may be cloud, shadow, missing coverage, a failed transfer, or a quality condition that excludes the data. Begin by representing these states explicitly. A missing observation is different from a low measurement, an unchanged surface, or a confirmed absence of the feature being studied. The distinction should survive both the analysis and the presentation of the result.
Define when a temporal gap is acceptable for the intended decision. A workflow may continue using the latest qualified observation, request another source, or suspend an alert until sufficient evidence is available. Whichever response is selected, show the age of the supporting observation. If interpolation is used for a suitable analytical purpose, preserve the distinction between an estimated value and a directly observed measurement, together with the assumptions needed to interpret it.
Review how gaps affect the coverage of the final evaluation. Locations with frequent missing data may differ systematically from those with regular observations. A performance estimate based only on clear, complete records can therefore describe a narrower population than the service is expected to support. Report usable coverage alongside analytical results and use recurring gaps to guide acquisition planning, reference collection, and the selection of complementary observation methods.
Bring the evidence back to the decision
Quality control is most useful when its results travel with the information being delivered. Preserve the reasons for accepting or rejecting an observation, and expose limitations that could change the user's interpretation. Review recurring failures as clues about the design of the workflow. A clear quality record supports consistent comparisons between operators and processing versions, while helping the team decide whether a problem originates in acquisition, preparation, interpretation, or the underlying observation requirements.
Sources & further reading
Explore the bhumisat spacecraft concept and our vision towards 2030, or return to the journal.