Every observation and interpretation contains uncertainty, but the sources and consequences of that uncertainty differ between applications. Some arise from acquisition conditions, others from reference measurements, processing choices, or the transfer of a model to a new setting. This perspective examines how those sources affect the decision a user is considering. It encourages teams to describe uncertainty in a form that can influence action, rather than adding a generic qualification at the end of a report. The objective is to support proportionate decisions while keeping the limits of the available evidence understandable.
This working guide considers designing reproducible cloud processing workflows in turbid coastal waters. The immediate decision is to identify coastal sampling priorities. Useful reference evidence includes water samples, surface conditions and acquisition-time context. The case is an illustrative planning context, with assumptions to check against the actual sensor, landscape and project requirements.
Move the computation with a clear plan
Cloud processing can place analysis near a large satellite archive and reduce repeated transfers to a local computer. Its value depends on the workload. A small study may be easier to complete with a few downloaded scenes, while a continental time series benefits from selective reads and distributed processing. Begin with the geographic extent, dates, variables and output resolution that the analysis actually needs.
Inspect the storage format before choosing an execution pattern. Tiled imagery can support reading only intersecting blocks, and chunked multidimensional arrays can support selected time and spatial slices. These benefits depend on how data are organized and how the reader accesses them. Repeatedly opening complete remote files for tiny requests can waste time and bandwidth. Match processing chunks to source layout where practical, and avoid creating more small tasks than the scheduler can manage efficiently.
Make each run explainable and recoverable
Keep source identifiers, processing versions, input checksums where available, parameters and software dependencies with the workflow. Explicitly record projections, resampling methods, scale factors, masks and time aggregation rules. An output filename alone cannot capture these decisions. A small manifest linking inputs to outputs is useful when an archive is reprocessed or a result must be reproduced months later.
Develop on a representative subset that includes awkward cases such as missing bands, empty intersections and scenes with extensive cloud. Check numerical results and output metadata before expanding the workload. Design individual tasks so they can safely restart without duplicating completed results. Write intermediate output to a temporary location, verify it, and only then mark the task complete. Retain useful logs without recording access credentials.
Estimate storage, compute and data transfer costs together. Compression, unnecessary copies and repeated intermediate materialization can change the budget substantially. Monitor resource use during a pilot run and establish sensible limits before launching a large batch. Permissions should give each process the access it needs, and credentials should come from an appropriate secure mechanism. Finally, export an accessible result with provenance and quality information. A fast calculation becomes useful science only when another person can understand and inspect what was produced.
The setting: Turbid coastal waters
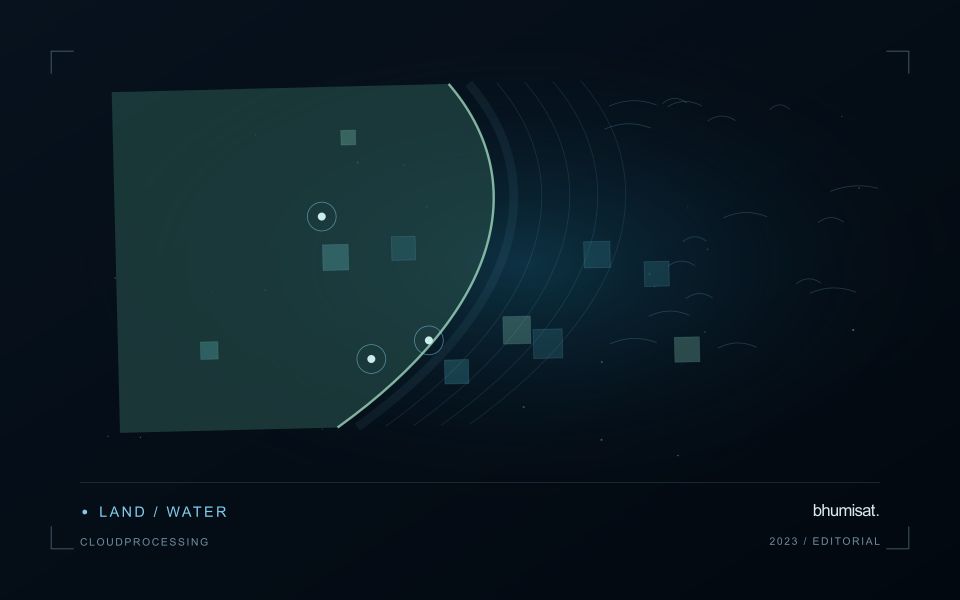
Turbid coastal waters contain changing mixtures of suspended material, dissolved substances, biological components and surface reflections. Their image appearance may vary over short distances and between acquisitions. A monitoring design should identify which variable or pattern it aims to investigate rather than treating every colour difference as a direct water-quality measurement. Coastal geometry and the proximity of land also influence which parts of an image provide a defensible observation of water.
Review atmospheric conditions, cloud, shadow, sun glint and land adjacency before comparing spectral measurements. Shallow-bottom contributions can matter in some places, while deeper areas may present a different interpretation problem. A relationship developed for one water type should not be transferred automatically to another. Retain the valid observation mask and the dates supporting each map so that users can distinguish measured patterns from periods without suitable optical evidence.
Field validation should sample the range of conditions in which a model or interpretation rule will operate. Record collection time, location and the measurement method for the target variable, together with relevant surface conditions. Samples and imagery separated by a changing coastal event may not be comparable. A useful product can guide sampling or describe a consistent spectral pattern, with stronger numerical water-quality claims introduced only when their calibration and independent evaluation support the intended application.
Check spatial alignment before comparison
A comparison between images, channels, maps, or field measurements assumes that the observations refer to the same locations at a suitable level of precision. Small alignment errors can become especially important near boundaries or narrow features. Before interpreting differences, inspect whether identifiable, stable features agree between the sources. A common coordinate reference is necessary for many workflows, but it does not by itself demonstrate accurate alignment.
Use control features that are appropriate for the observation scale and remain stable across the comparison period. Evaluate alignment in more than one part of the area, because a single location cannot reveal spatially varying distortion. Record the method used to estimate any correction and retain independent features for checking the corrected result. Where surfaces have genuinely changed, avoid using those changes as evidence of an alignment error.
Propagate the implications of remaining misalignment into the analysis. A workflow may exclude boundary pixels, summarise at a broader scale, or qualify interpretations for small features. The choice should follow the application rather than a preference for visually smooth output. Preserve both the original and corrected geographic references, and document resampling decisions so that future users can understand how measurements were moved onto a common spatial framework.
Maintain the geographic units of analysis
Many observation services summarise measurements within a field, management block, catchment, forest unit, or other mapped boundary. The meaning of that summary depends on whether the boundary accurately represents the unit being discussed. Start with a clear source for the geometry and record its date, coordinate reference, and intended use. A boundary drawn for visual orientation may require additional checking before it becomes a measurement unit.
Inspect overlaps, gaps, narrow fragments, and features that may have changed since mapping. A geometrically valid polygon can still describe an outdated operational unit. Ask the responsible team how divisions, mergers, new infrastructure, and management changes are recorded. Where pixels or reference measurements cross a boundary, define how they are assigned or excluded so that results remain comparable between analysts and processing runs.
Version the boundaries alongside the observations. If a unit changes, preserve a relationship between the previous and revised geometry rather than replacing the history without explanation. Comparisons through time should identify whether they use a constant spatial unit or the operational units valid at each date. This makes it easier to distinguish a change in the measured surface from a change introduced by the geography used to summarise it.
Bring the evidence back to the decision
Useful uncertainty communication identifies the limitation, explains how it could affect the result, and connects it to a practical response. Some decisions can proceed with a qualified estimate; others require another observation or an independent check. Preserve uncertainty information through processing and delivery so that it is available at the point of use. This makes the analysis more accountable and gives the team a clearer basis for deciding which additional evidence would most improve the outcome.
Sources & further reading
Explore the bhumisat spacecraft concept and our vision towards 2030, or return to the journal.