Remote observations show patterns, while practical decisions depend on explaining what those patterns could mean. Interpretation therefore requires more than locating a high or low value on a map. A useful analysis considers the timing of the observation, the physical processes that influence the measurement, and the information available from complementary sources. This perspective separates an observed signal from a proposed explanation and from an action recommended to a user. Keeping those stages distinct makes it easier to investigate alternative causes, communicate ambiguity, and choose a proportionate next step.
This working guide considers designing reproducible cloud processing workflows in soybean production fields. The immediate decision is to direct scouting to unusual field zones. Useful reference evidence includes planting dates, canopy closure and crop-stage observations. The case is an illustrative planning context, with assumptions to check against the actual sensor, landscape and project requirements.
Move the computation with a clear plan
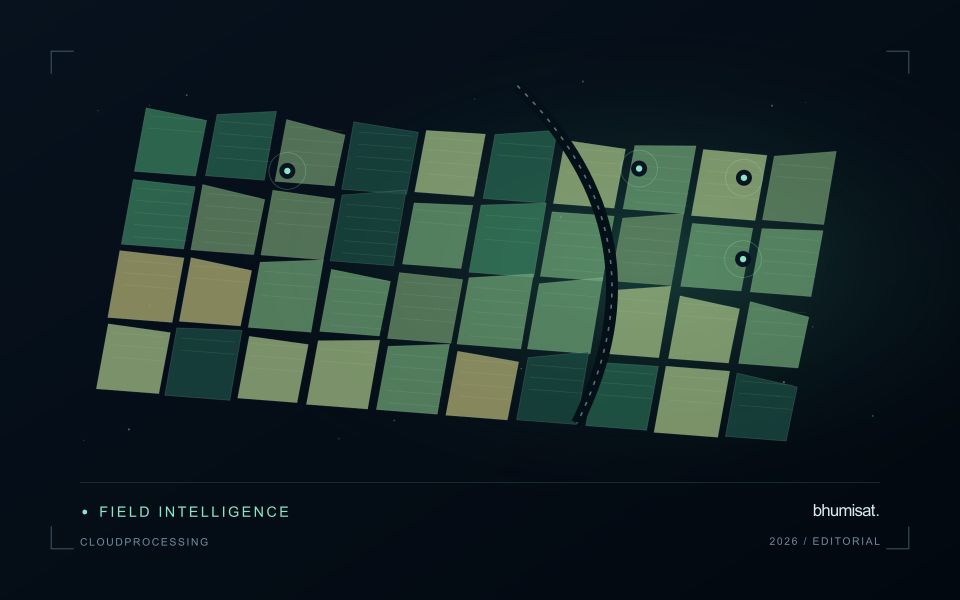
Cloud processing can place analysis near a large satellite archive and reduce repeated transfers to a local computer. Its value depends on the workload. A small study may be easier to complete with a few downloaded scenes, while a continental time series benefits from selective reads and distributed processing. Begin with the geographic extent, dates, variables and output resolution that the analysis actually needs.
Inspect the storage format before choosing an execution pattern. Tiled imagery can support reading only intersecting blocks, and chunked multidimensional arrays can support selected time and spatial slices. These benefits depend on how data are organized and how the reader accesses them. Repeatedly opening complete remote files for tiny requests can waste time and bandwidth. Match processing chunks to source layout where practical, and avoid creating more small tasks than the scheduler can manage efficiently.
Make each run explainable and recoverable
Keep source identifiers, processing versions, input checksums where available, parameters and software dependencies with the workflow. Explicitly record projections, resampling methods, scale factors, masks and time aggregation rules. An output filename alone cannot capture these decisions. A small manifest linking inputs to outputs is useful when an archive is reprocessed or a result must be reproduced months later.
Develop on a representative subset that includes awkward cases such as missing bands, empty intersections and scenes with extensive cloud. Check numerical results and output metadata before expanding the workload. Design individual tasks so they can safely restart without duplicating completed results. Write intermediate output to a temporary location, verify it, and only then mark the task complete. Retain useful logs without recording access credentials.
Estimate storage, compute and data transfer costs together. Compression, unnecessary copies and repeated intermediate materialization can change the budget substantially. Monitor resource use during a pilot run and establish sensible limits before launching a large batch. Permissions should give each process the access it needs, and credentials should come from an appropriate secure mechanism. Finally, export an accessible result with provenance and quality information. A fast calculation becomes useful science only when another person can understand and inspect what was produced.
The setting: Soybean production fields
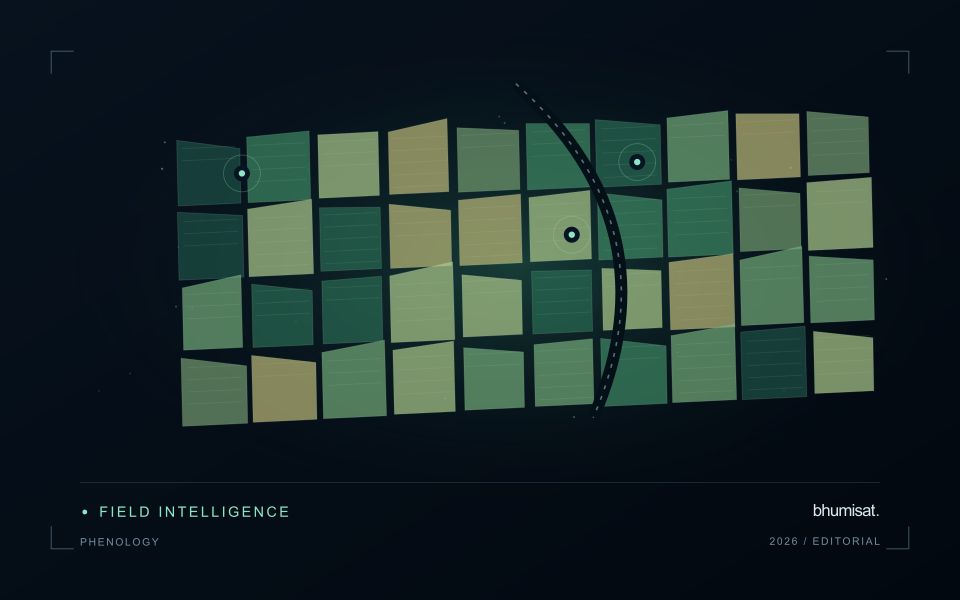
Soybean imagery can show substantial variation as fields progress from exposed soil to closed canopy and eventually to maturity. Planting date, stand arrangement, variety and management can shift that progression. Use these factors to define comparison groups before labelling a field unusual. The boundary dataset should distinguish the planted area from tracks, drainage features and other surfaces that can contribute a large share of the measurement in small or irregular fields.
A practical analytical sequence combines quality-screened imagery with the field calendar and relevant management notes. Review whether an apparent difference persists across usable observations and whether it follows a plausible spatial pattern within the field. An index response can be affected by background soil, weeds, residue or illumination as well as the crop. These possibilities should guide the investigation rather than being collapsed into an automatic claim about plant nutrition or disease.
A field team can test whether the mapped zones correspond to different crop stages or other observable conditions. Collect samples across the range of mapped responses, and include typical areas to avoid evaluating only conspicuous anomalies. Where production estimates are proposed, match the spatial and temporal scale of the reference data to the prediction. A field-average yield record cannot directly validate every small pixel-level variation shown on an attractive map.
Design field observations around the information need
Field observations are most useful when they answer a defined question within the monitoring workflow. Begin by identifying the variable, condition, or management event that needs to be recorded and the geographic unit to which it applies. Distinguish direct measurements from an observer's interpretation. A consistent record of crop stage, management timing, and visible conditions can provide valuable context even when the field team is not collecting a complex set of measurements.
Prepare a collection protocol that reflects the variability of the site. Define where observations are made within a unit, how many locations are represented, and how the position and time are recorded. Avoid selecting only the most dramatic or convenient examples. Include apparently normal conditions and records that might challenge the remote interpretation. Where a measurement method has known limitations, preserve the information needed to assess whether those limitations affect the intended comparison.
Link field records to the corresponding remote observations without losing their original detail. Geographic matching, timing, and the scale represented by each record should remain visible. Review disagreements with the collecting team before changing a label or excluding an observation. A disagreement may reveal a timing mismatch, a mixed surface, or an incomplete interpretation rather than a simple error. The field programme should improve the understanding of the monitoring process as well as provide evidence for evaluating its outputs.
Prioritise alerts using evidence and consequence
An alert is a request for attention, so its design should consider both the evidence available and the cost of responding. Begin by distinguishing a measured change, a proposed interpretation, and the action expected from the recipient. A large numerical difference is not automatically the most urgent case. The significance of the location, the age of the observation, the confidence in the interpretation, and the consequences of delay can all influence priority.
Create a review queue with enough context to support consistent decisions. Useful information can include the supporting dates, quality qualifications, previous observations, geographic unit, and the reason the case entered the queue. Define when an alert can be closed, escalated, or held for another observation. A documented rule is easier to improve than an informal practice that depends entirely on the memory of the operator reviewing the result.
Collect feedback from inspections and operational responses. Record alerts that led to a useful finding, alerts that required no action, and important conditions that the system failed to flag. Review these outcomes across different settings rather than relying only on a total count of alerts. The objective is a queue that directs limited attention towards meaningful decisions, while generating evidence for adjusting thresholds, improving context, and reducing repeated sources of unnecessary work.
Bring the evidence back to the decision
A strong interpretation states what was observed, which explanations remain plausible, and what additional evidence would help distinguish them. Avoid presenting a convenient label as a confirmed cause when the measurements support only a broader pattern. Connect the proposed next step to the significance of the decision and the confidence available. This creates an interpretation that a field team, analyst, or project partner can examine, challenge, and improve as further observations become available.
Sources & further reading
Explore the bhumisat spacecraft concept and our vision towards 2030, or return to the journal.