An analytical result becomes operational information only when the receiving team can understand it and use it within existing responsibilities. Handoffs often fail because assumptions that were obvious to the analyst are absent from the delivered product. This perspective considers the information needed at that boundary: acquisition time, processing status, geographic scope, quality qualifications, and the action expected from the recipient. It also asks how corrections and feedback should return to the producing team. A dependable handoff creates a shared understanding of the result, rather than merely transferring a file.
This working guide considers cloud and shadow screening for optical imagery in rainfed rice landscapes. The immediate decision is to focus visits after uneven rainfall. Useful reference evidence includes planting dates, field moisture observations and crop stage. The case is an illustrative planning context, with assumptions to check against the actual sensor, landscape and project requirements.
A quality mask changes the evidence available
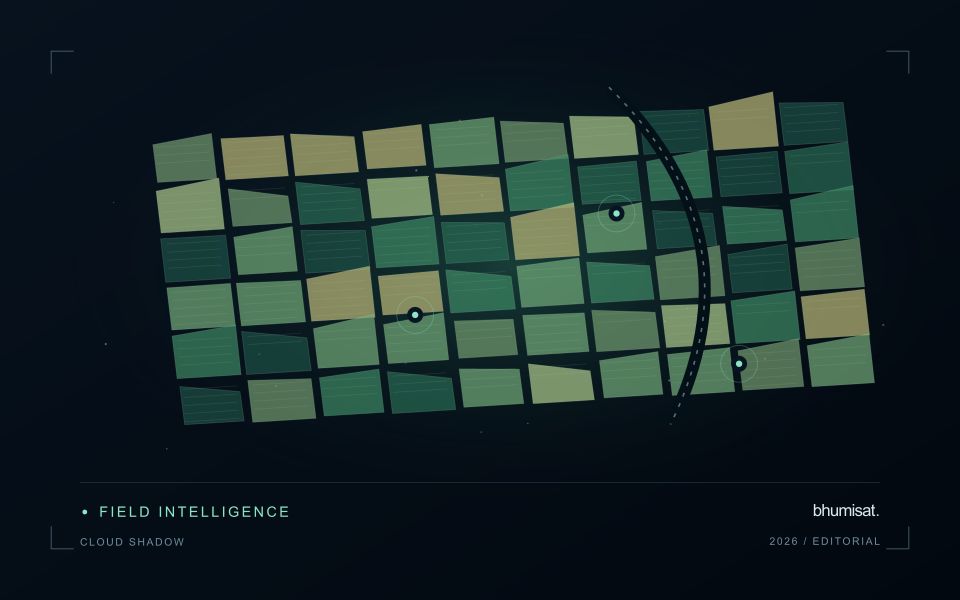
Clouds and their shadows can produce strong changes in optical imagery that have little to do with the condition of the land beneath them. A quality mask identifies observations that should be excluded or treated cautiously for a particular analysis. It is not simply a cosmetic step used to improve an image. The mask determines which measurements contribute to an index, field statistic or time-series model. Its assumptions therefore belong in the analytical record and should remain available when a result is reviewed.
A scene with a low overall cloud percentage can still be unsuitable for a particular farm. Conversely, a partly cloudy scene may contain useful observations over the target fields. Evaluate quality at the area of interest rather than relying only on scene-level metadata. Cloud edges, haze and shadow boundaries can be difficult to classify consistently. Depending on the application, an additional exclusion around a flagged feature may be appropriate. The effect of that choice on usable coverage should be measured instead of hidden.
Check the mask as part of the result
Inspect representative successful and unsuccessful cases before adopting a mask rule across a large archive. Check whether bright soil, roofs, water or dark vegetation are being confused with cloud or shadow. Compare automatic flags with image context and, where available, independent observations. A mask that removes too much valid data can be harmful, while one that retains contamination can create false alerts. The acceptable balance depends on the downstream task and the costs of missed observations and misleading interpretations.
Each delivered field result should state the acquisition date and the fraction of the relevant area supported by valid measurements. If too little remains, a missing result can be more informative than a precise-looking number based on an unrepresentative fragment. Keep observation gaps visible in charts and maps. When the masking method or product version changes, assess how the update affects historical comparability. Treating cloud and shadow screening as part of the evidence chain makes the final agricultural or environmental interpretation easier to audit and more dependable in practice.
The setting: Rainfed rice landscapes
Rainfed rice fields often follow planting calendars shaped by local rainfall, water retention and household decisions. Nearby fields may begin their crop cycles at different times, and some areas may remain unplanted during a reporting period. A monitoring system needs to separate these timing differences from potentially unusual crop development. Start with field boundaries and a record of whether a crop was actually established, together with the best available estimate of its establishment date.
Interpreting an image sequence requires attention to both vegetation and the recent water context. Soil background, temporary standing water and incomplete canopy cover can strongly influence early observations. Rainfall information can help describe the season, but it should not be treated as a direct measurement of water available to every field. Differences in drainage, soil properties and topographic position can create contrasting conditions within a short distance.
Use the analysis to select field questions that can be checked, such as delayed establishment or uneven canopy development. Record crop stage, recent management, visible water conditions and the circumstances that affected planting. Where production estimates are proposed, connect them to representative harvest observations rather than relying on an index threshold. Results should show observation dates and missing periods so that users can judge how current the evidence is before arranging an inspection.
Organise imagery and results for reliable retrieval
A useful storage design helps people and software find the right observation without relying on informal knowledge of folder names. Separate immutable source data from temporary processing files and delivered products. Give each observation a stable identifier and preserve its acquisition metadata alongside the file. A predictable organisation reduces the chance that a later analysis accidentally uses a preview, an outdated result, or an intermediate product whose meaning has not been documented.
Choose an indexing scheme that reflects the questions the workflow needs to answer. Location, acquisition time, source, product type, and processing version are often useful search dimensions. The physical arrangement of files can differ from the logical catalogue, provided that the relationship is maintained reliably. Record checksums or other integrity information where appropriate, and test whether an observation can be recovered using the catalogue rather than a particular operator's memory.
Define retention rules for source, intermediate, and delivered information. Some intermediate products are inexpensive to reproduce, while others embody costly preparation or expert review. Keep the inputs and configuration needed to rebuild a result before removing reproducible files. Test backup and recovery procedures with representative products, including their metadata and geographic references. Reliable retrieval is demonstrated by a successful reconstruction of useful information, rather than by the existence of an untested copy.
Budget the complete processing workflow
A processing budget should cover the complete path from source observations to a maintained product. Data access and computing are only part of that path. Include preparation, geographic updates, reference collection, expert review, delivery, and support where those activities belong to the service. A calculation that runs cheaply on a small demonstration can still require substantial effort when the surrounding work is repeated across many locations.
Measure representative tasks rather than assuming that every observation costs the same amount to process. Record data volume, processing time, retry frequency, manual interventions, and the conditions that create unusually demanding cases. Separate fixed setup work from work that grows with the number of observations or users. These records support decisions about batching, caching, storage policy, and the point at which a different processing design becomes worthwhile.
Connect the budget to a defined level of service. Faster delivery, more frequent observation, broader coverage, or more detailed review can each change the resources required. Describe these trade-offs before promising a delivery pattern that the workflow has not demonstrated. Review the budget using operational evidence and preserve enough detail to understand changes between processing versions. The aim is a sustainable service whose resource choices remain aligned with the information that users value.
Bring the evidence back to the decision
A successful handoff leaves the recipient with a clear result, sufficient context, and a practical route for raising questions. Test the delivery with the people who will use it, including how they respond when observations are missing or qualified. Capture their feedback as evidence for improving the product. The most useful delivery format is the one that preserves the relevant technical meaning while fitting the decisions, time constraints, and responsibilities of its intended audience.
Sources & further reading
Explore the bhumisat spacecraft concept and our vision towards 2030, or return to the journal.