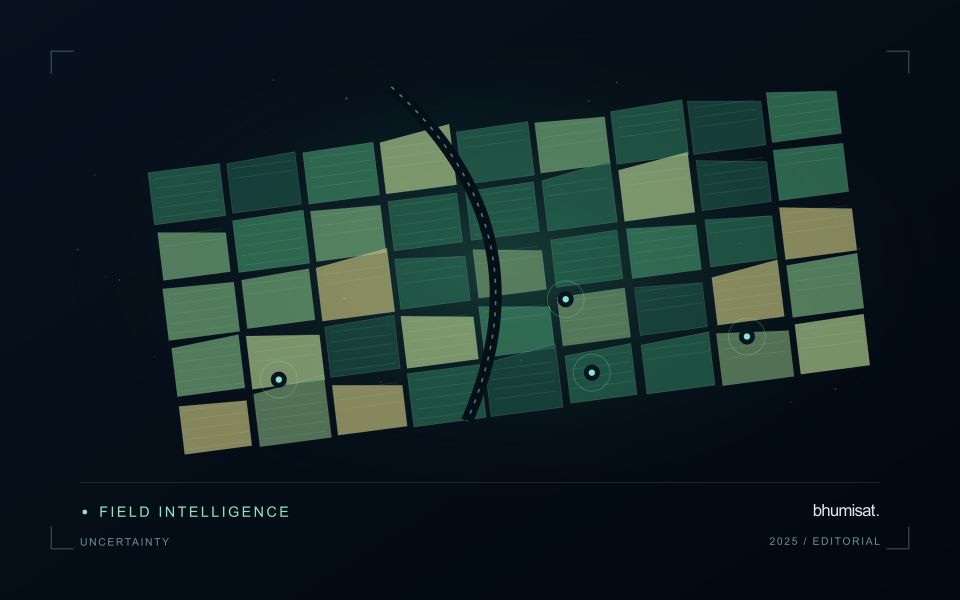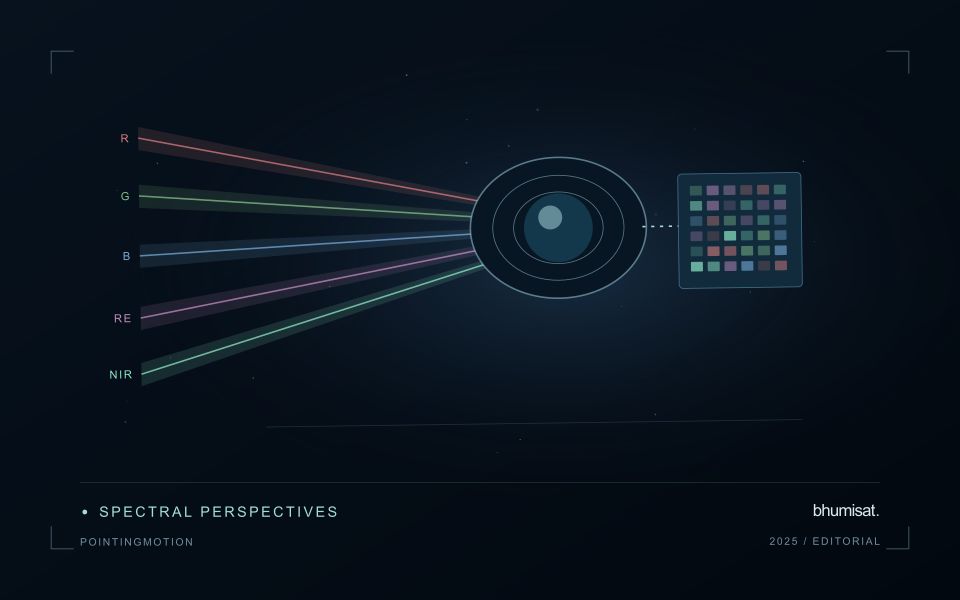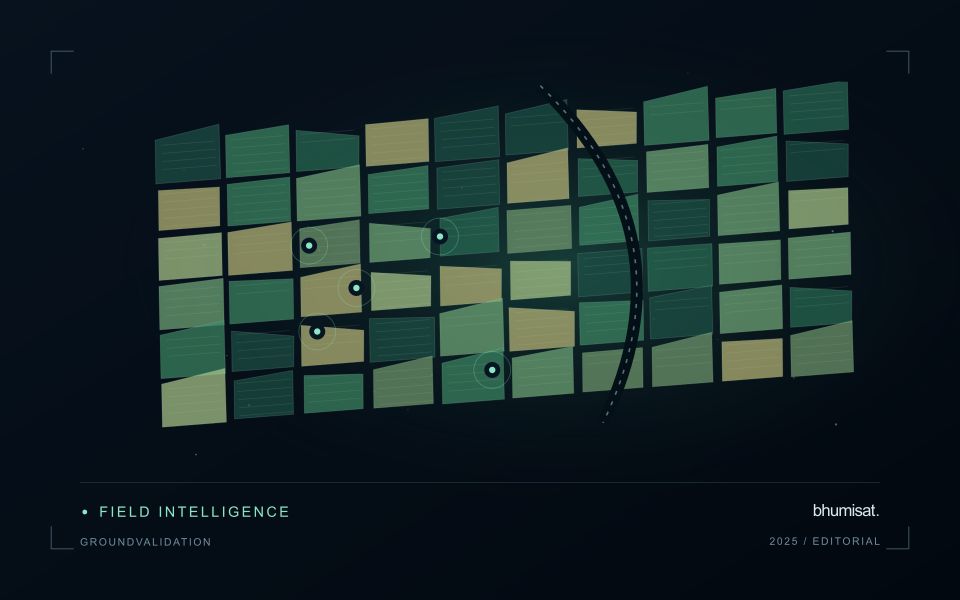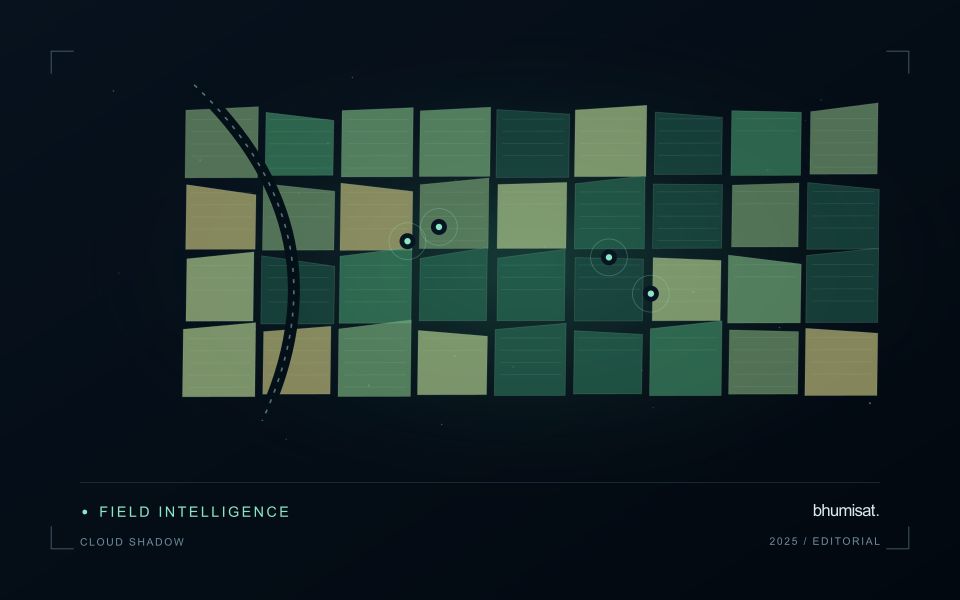
A convincing image can still contain measurements that are unsuitable for a particular task. Quality control asks whether the inputs, transformations, and outputs meet the requirements of the intended application. This perspective follows evidence through the workflow, from acquisition metadata and reference observations to the final interpretation. It encourages teams to define acceptance conditions before seeing the result, rather than adjusting them to favour a preferred conclusion. The purpose is a repeatable way to distinguish usable observations, observations requiring qualification, and observations that should be excluded from a decision.
This working guide considers cloud and shadow screening for optical imagery in potato growing fields. The immediate decision is to focus scouting within potato fields. Useful reference evidence includes emergence records, canopy stage and representative plot observations. The case is an illustrative planning context, with assumptions to check against the actual sensor, landscape and project requirements.
A quality mask changes the evidence available
Clouds and their shadows can produce strong changes in optical imagery that have little to do with the condition of the land beneath them. A quality mask identifies observations that should be excluded or treated cautiously for a particular analysis. It is not simply a cosmetic step used to improve an image. The mask determines which measurements contribute to an index, field statistic or time-series model. Its assumptions therefore belong in the analytical record and should remain available when a result is reviewed.
A scene with a low overall cloud percentage can still be unsuitable for a particular farm. Conversely, a partly cloudy scene may contain useful observations over the target fields. Evaluate quality at the area of interest rather than relying only on scene-level metadata. Cloud edges, haze and shadow boundaries can be difficult to classify consistently. Depending on the application, an additional exclusion around a flagged feature may be appropriate. The effect of that choice on usable coverage should be measured instead of hidden.
Check the mask as part of the result
Inspect representative successful and unsuccessful cases before adopting a mask rule across a large archive. Check whether bright soil, roofs, water or dark vegetation are being confused with cloud or shadow. Compare automatic flags with image context and, where available, independent observations. A mask that removes too much valid data can be harmful, while one that retains contamination can create false alerts. The acceptable balance depends on the downstream task and the costs of missed observations and misleading interpretations.
Each delivered field result should state the acquisition date and the fraction of the relevant area supported by valid measurements. If too little remains, a missing result can be more informative than a precise-looking number based on an unrepresentative fragment. Keep observation gaps visible in charts and maps. When the masking method or product version changes, assess how the update affects historical comparability. Treating cloud and shadow screening as part of the evidence chain makes the final agricultural or environmental interpretation easier to audit and more dependable in practice.
The setting: Potato growing fields
Potato monitoring begins with the distinction between the canopy visible from above and the crop component ultimately harvested below ground. Establishment timing, variety, row structure and management can create different canopy patterns across fields. An image service should specify whether it is supporting crop-stage assessment, identifying areas for inspection or estimating a defined production variable. These objectives require different reference measurements and should not be combined into one unqualified vegetation score.
Maintain a field timeline that includes planting, emergence and the operations that can affect canopy appearance. Early observations may contain a large soil contribution, while later observations may show a more continuous canopy. Cloud and shadow contamination, field edges and neighbouring land cover can alter summaries at either stage. Compare observations using suitable quality rules and retain the acquisition dates so that a recent-looking map does not conceal an old measurement.
A field team should collect consistent crop-stage and canopy observations across both flagged and typical areas. Record management context and sampling support rather than relying on an isolated photograph. A vegetation change cannot establish the presence of a specific disease, and a canopy index is not a direct measurement of tuber yield. Evaluate any production model with appropriate harvest data and independent assessment, while keeping the simpler inspection-priority product transparent about what it actually observes.
Preserve a reproducible processing history
A result should be linked to the inputs and processing choices that produced it. Record source identifiers, software versions, configuration values, reference data versions, and the time of processing. The record does not need to expose every internal implementation detail to the end user. It must preserve enough information for the producing team to investigate a result, reproduce a comparison, and explain why a revised product differs from an earlier version.
Version changes that can affect the meaning of the output. Updated boundaries, a new quality mask, revised calibration, different model parameters, or altered aggregation rules can all change results even when the source imagery is unchanged. Avoid overwriting an earlier product without retaining a suitable history. A clear relationship between versions helps users distinguish an improvement in processing from a real change in the observed surface.
Use representative regression cases when modifying the workflow. Select cases that cover ordinary conditions and known failure modes, then compare meaningful outputs before and after the change. Investigate differences against the intended purpose of the revision rather than assuming that a closer visual match is always preferable. Preserve the review decision with the version record. Reproducibility becomes practical when the team can trace a result through a documented sequence of inputs, transformations, tests, and delivery decisions.
Design field observations around the information need
Field observations are most useful when they answer a defined question within the monitoring workflow. Begin by identifying the variable, condition, or management event that needs to be recorded and the geographic unit to which it applies. Distinguish direct measurements from an observer's interpretation. A consistent record of crop stage, management timing, and visible conditions can provide valuable context even when the field team is not collecting a complex set of measurements.
Prepare a collection protocol that reflects the variability of the site. Define where observations are made within a unit, how many locations are represented, and how the position and time are recorded. Avoid selecting only the most dramatic or convenient examples. Include apparently normal conditions and records that might challenge the remote interpretation. Where a measurement method has known limitations, preserve the information needed to assess whether those limitations affect the intended comparison.
Link field records to the corresponding remote observations without losing their original detail. Geographic matching, timing, and the scale represented by each record should remain visible. Review disagreements with the collecting team before changing a label or excluding an observation. A disagreement may reveal a timing mismatch, a mixed surface, or an incomplete interpretation rather than a simple error. The field programme should improve the understanding of the monitoring process as well as provide evidence for evaluating its outputs.
Bring the evidence back to the decision
Quality control is most useful when its results travel with the information being delivered. Preserve the reasons for accepting or rejecting an observation, and expose limitations that could change the user's interpretation. Review recurring failures as clues about the design of the workflow. A clear quality record supports consistent comparisons between operators and processing versions, while helping the team decide whether a problem originates in acquisition, preparation, interpretation, or the underlying observation requirements.
Sources & further reading
Explore the bhumisat spacecraft concept and our vision towards 2030, or return to the journal.