A useful observation programme begins with a decision that somebody can act on. Before selecting imagery or instruments, define the area of interest, the people responsible for inspecting it, and the time available for a response. This planning perspective connects remote measurements with the practical questions that shape a survey or monitoring service. The aim is to identify which observations would change a decision, how supporting evidence would be collected, and what should happen when information is incomplete. A clear plan makes later technical choices easier to assess against an operational purpose.
This working guide considers cloud and shadow screening for optical imagery in maize production fields. The immediate decision is to prioritise uneven-development scouting. Useful reference evidence includes emergence dates, plant stand notes and field stage. The case is an illustrative planning context, with assumptions to check against the actual sensor, landscape and project requirements.
The setting: Maize production fields
Maize fields can differ in emergence date, variety, plant density and management even within the same growing region. An image comparison is more meaningful when those differences are recorded. Early in the cycle, visible soil and row arrangement can influence a field summary substantially. Later, the canopy may become dense enough that some vegetation measures respond less clearly to additional growth. Interpret the observations in relation to the crop stage and the variable of interest.
Construct a field timeline that marks establishment, important field operations and the dates of usable observations. A decline or delayed increase in a signal can suggest a place to investigate, but several explanations may be possible. Soil conditions, weeds, storm effects and crop timing can produce patterns that require field context. Avoid turning a general anomaly map into a specific diagnosis without measurements that distinguish between these alternatives.
A scouting plan should include representative normal areas as well as the locations ranked most unusual. Record crop stage, stand continuity, visible damage and management information consistently. Production models require their own training and evaluation data, ideally covering different fields and seasons. For operational use, assess whether a satellite-derived priority list helps the field team find relevant conditions efficiently, and report the observation age whenever weather leaves a gap in the current image sequence.
A quality mask changes the evidence available
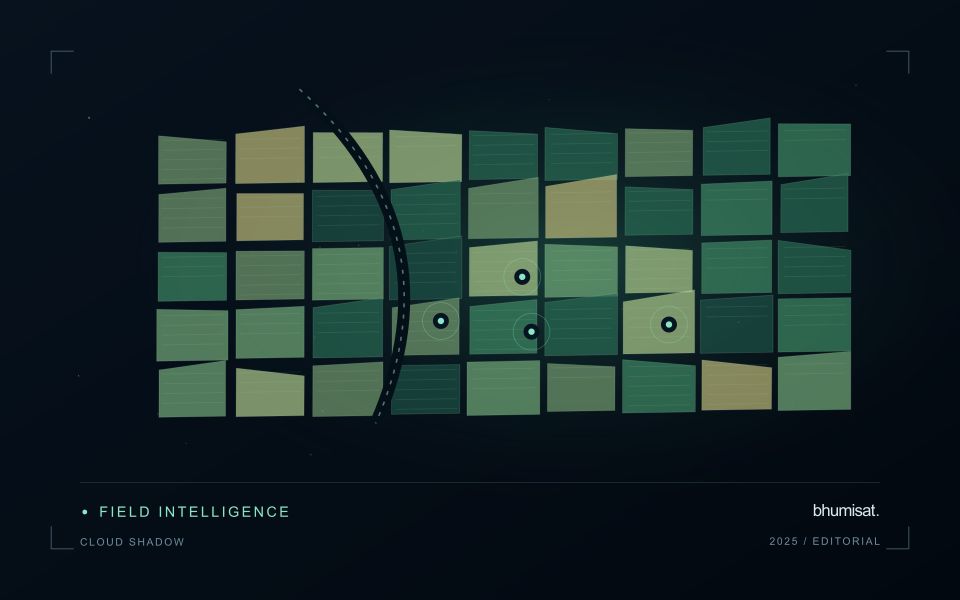
Clouds and their shadows can produce strong changes in optical imagery that have little to do with the condition of the land beneath them. A quality mask identifies observations that should be excluded or treated cautiously for a particular analysis. It is not simply a cosmetic step used to improve an image. The mask determines which measurements contribute to an index, field statistic or time-series model. Its assumptions therefore belong in the analytical record and should remain available when a result is reviewed.
A scene with a low overall cloud percentage can still be unsuitable for a particular farm. Conversely, a partly cloudy scene may contain useful observations over the target fields. Evaluate quality at the area of interest rather than relying only on scene-level metadata. Cloud edges, haze and shadow boundaries can be difficult to classify consistently. Depending on the application, an additional exclusion around a flagged feature may be appropriate. The effect of that choice on usable coverage should be measured instead of hidden.
Check the mask as part of the result
Inspect representative successful and unsuccessful cases before adopting a mask rule across a large archive. Check whether bright soil, roofs, water or dark vegetation are being confused with cloud or shadow. Compare automatic flags with image context and, where available, independent observations. A mask that removes too much valid data can be harmful, while one that retains contamination can create false alerts. The acceptable balance depends on the downstream task and the costs of missed observations and misleading interpretations.
Each delivered field result should state the acquisition date and the fraction of the relevant area supported by valid measurements. If too little remains, a missing result can be more informative than a precise-looking number based on an unrepresentative fragment. Keep observation gaps visible in charts and maps. When the masking method or product version changes, assess how the update affects historical comparability. Treating cloud and shadow screening as part of the evidence chain makes the final agricultural or environmental interpretation easier to audit and more dependable in practice.
Define a representative reference sample
A reference sample should represent the situations in which a method will be used. Begin by defining the target population: locations, time periods, management conditions, surface types, or instrument states that belong within the intended application. A collection of convenient observations may be valuable for exploration, but it does not automatically support conclusions about that wider population. Make the scope of the sample visible before calculating a summary of performance.
Consider a stratified design when important conditions are unevenly represented. Relevant strata might include different landscape types, developmental stages, observation quality levels, or ranges of the variable being estimated. Choose sample locations within those groups using a documented rule, and retain the information needed to understand their selection. Where access restrictions affect the sample, record the excluded conditions so that the limits of the resulting evaluation remain clear.
Keep development and evaluation evidence separate where the purpose of the study requires an independent test. Nearby observations or repeated measurements can share information, so a random split of individual records may overstate independence. A split organised by location, period, or operational unit can provide a more demanding comparison. The appropriate design follows the intended deployment, the structure of the observations, and the errors that matter to the user.
Keep an auditable review record
A review record should explain how a result moved from an analytical output to an accepted interpretation or operational decision. Preserve the product identifier, the evidence considered, the reviewer role, and the outcome of the review. A short, consistent record is often more useful than an extensive free-text note that cannot be compared between cases. The objective is to make important decisions traceable without turning routine review into unnecessary administrative work.
Separate observations from conclusions within the record. Describe the evidence visible to the reviewer, the alternative explanations considered where relevant, and the reason for accepting, qualifying, or rejecting the result. If a correction is required, identify what should change and how the revised product relates to the earlier version. Keep unresolved questions visible so that they can be addressed by another observation or by the person responsible for the next action.
Use the accumulated record to improve the workflow. Recurring review reasons can reveal unclear requirements, missing contextual information, unstable processing steps, or an evaluation gap. Examine whether similar cases receive similar decisions across reviewers and over time. Preserve the relationship between feedback and subsequent revisions so that improvements can be assessed against the evidence that motivated them. An auditable record supports learning, accountability, and consistent delivery while allowing the technical process to evolve.
Bring the evidence back to the decision
The practical outcome should be a short observation plan that another team can follow. It should name the decision, the required evidence, the responsible roles, and the conditions that trigger a field visit or further analysis. Keep the plan small enough to test, then revise it using the results of real inspections. A useful monitoring workflow improves because its assumptions are examined systematically, and its observations remain connected to decisions throughout the process.
Sources & further reading
Explore the bhumisat spacecraft concept and our vision towards 2030, or return to the journal.