A useful observation programme begins with a decision that somebody can act on. Before selecting imagery or instruments, define the area of interest, the people responsible for inspecting it, and the time available for a response. This planning perspective connects remote measurements with the practical questions that shape a survey or monitoring service. The aim is to identify which observations would change a decision, how supporting evidence would be collected, and what should happen when information is incomplete. A clear plan makes later technical choices easier to assess against an operational purpose.
This working guide considers viewing geometry and brdf effects along shallow reef-adjacent coasts. The immediate decision is to select coastal habitat survey areas. Useful reference evidence includes water conditions, survey timing and mapped substrate observations. The case is an illustrative planning context, with assumptions to check against the actual sensor, landscape and project requirements.
The observed surface has a direction-dependent response
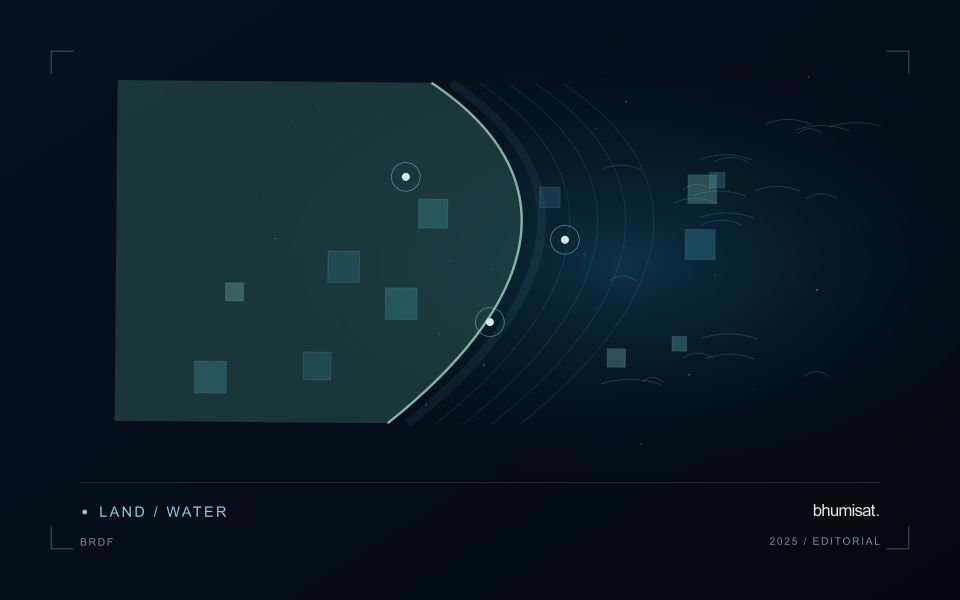
A surface does not necessarily reflect incoming light equally in every direction. Its measured brightness can change as the positions of the Sun, surface and sensor change, even when the surface itself is similar. The bidirectional reflectance distribution function provides a framework for describing this directional behaviour. In practical image analysis, the relevant lesson is that a difference between observations may contain a geometry effect as well as a real surface change. Canopy structure, shadows and surface roughness can all influence that relationship.
The magnitude and pattern of a geometry effect depend on the landscape and spectral measurement. A row crop, closed forest and exposed soil need not behave in the same way. Terrain introduces another layer because slope and aspect alter local illumination. A simple brightness adjustment is not automatically an adequate solution. A workflow should first identify the type of comparison it needs and whether the available product already includes a relevant normalisation. Applying an additional correction without understanding prior processing can create a new inconsistency.
Normalise geometry with a clear purpose
Geometry normalisation uses a model or adjustment to express observations under a more consistent reference condition. It is an approximation designed for a defined purpose, and its performance should be checked rather than assumed. Keep the input geometry, model assumptions and processing version where they are available. Compare representative surfaces before and after the adjustment. A useful test examines whether the correction reduces systematic variation in stable areas while preserving changes that are supported independently by management records or field observations.
For an agricultural service, the importance of this effect depends on the size of the change being interpreted. A subtle trend can be more sensitive to residual geometry variation than a major harvest event. Evaluate whether an apparent improvement in a time series survives across seasons and fields, including those with different canopy arrangements. Retain a clear explanation of what has been normalised and what remains uncertain. Viewing geometry becomes manageable when it is treated as part of the measurement context instead of being attributed silently to crop condition or land-cover change.
The setting: Shallow reef-adjacent coasts
A shallow coastal image can contain a mixture of water-column effects, bottom reflectance, surface reflection and adjacent land. The contribution of the seabed depends on conditions that vary across space and time. A monitoring task should therefore identify what can reasonably be observed at the selected scale. Mapping broad substrate patterns or selecting survey locations is different from diagnosing the condition of individual coral colonies or other small habitat features.
Review water clarity, depth context where available, cloud, atmospheric quality and sun glint before interpreting a spectral difference. Changes in the water above the bottom may alter the image without a corresponding change in the substrate. Shorelines and narrow reef features are also sensitive to mixed pixels and alignment. Comparisons should retain their acquisition dates and processing assumptions so that users can understand what environmental conditions support the proposed interpretation.
Field surveys should document the area represented by each observation and distinguish substrate descriptions from measurements of biological condition. Survey timing and water conditions matter when relating those records to imagery. A broad remotely sensed class cannot validate every feature inside its footprint. Use representative and independent assessment locations where possible, and communicate where the result supports a landscape-scale interpretation or a survey priority rather than a fine-scale ecological conclusion.
Translate the decision into observation requirements
Start with the decision that the information is intended to support. Describe the geographic unit, the time available for acting, and the consequence of an incorrect interpretation. A requirement such as detecting an unusual pattern across management blocks is different from identifying its cause. Keeping that distinction explicit helps a team select measurements that are relevant to the application and prevents later evaluation from drifting towards whatever result happens to be easiest to demonstrate.
Build a compact requirements matrix linking each decision to the evidence needed, the proposed observation source, and an acceptance condition. Include geographic accuracy, temporal relevance, quality screening, and the context required for interpretation. The matrix should also identify the evidence used to justify each requirement. An engineering preference or a convenient data source can inform a study, but neither should silently replace a documented information need.
Review the matrix with the people who will use the result. Ask how their response would change when information is delayed, incomplete, or uncertain. Record unresolved requirements as questions for a pilot rather than converting them into confident specifications. This produces a practical framework for comparing technical options, designing tests, and explaining why an observation is useful to the intended workflow.
Connect observations within a catchment
Water-related observations often depend on processes beyond the immediate pixel or sampling location. Begin by identifying the geographic relationships that are relevant to the question: upstream areas, connected drainage paths, contributing land uses, and the receiving water body. A local pattern may be easier to interpret when placed within that wider setting. The catchment boundary is a useful organising unit, but its suitability should be checked against the process and observation scale.
Combine the remote observation with contextual records that can help explain its timing and spatial pattern. Rainfall, water level, land management, and known interventions can influence what is observed. Preserve the dates and geographic meaning of those records rather than treating them as timeless attributes. Where drainage connections are uncertain or change with conditions, state the limitation and consider whether additional mapping or reference observations would materially improve the interpretation.
Plan reference sampling across locations that distinguish plausible explanations. A set of measurements concentrated at an easily accessible outlet may provide a different view from one that also represents tributaries, source areas, and contrasting conditions. Document how each location contributes to the evaluation. Interpret spatial agreement with care, because connected observations can share influences and may not provide independent evidence. The resulting workflow should connect local measurements with a defensible account of the wider system they help describe.
Bring the evidence back to the decision
The practical outcome should be a short observation plan that another team can follow. It should name the decision, the required evidence, the responsible roles, and the conditions that trigger a field visit or further analysis. Keep the plan small enough to test, then revise it using the results of real inspections. A useful monitoring workflow improves because its assumptions are examined systematically, and its observations remain connected to decisions throughout the process.
Sources & further reading
Explore the bhumisat spacecraft concept and our vision towards 2030, or return to the journal.