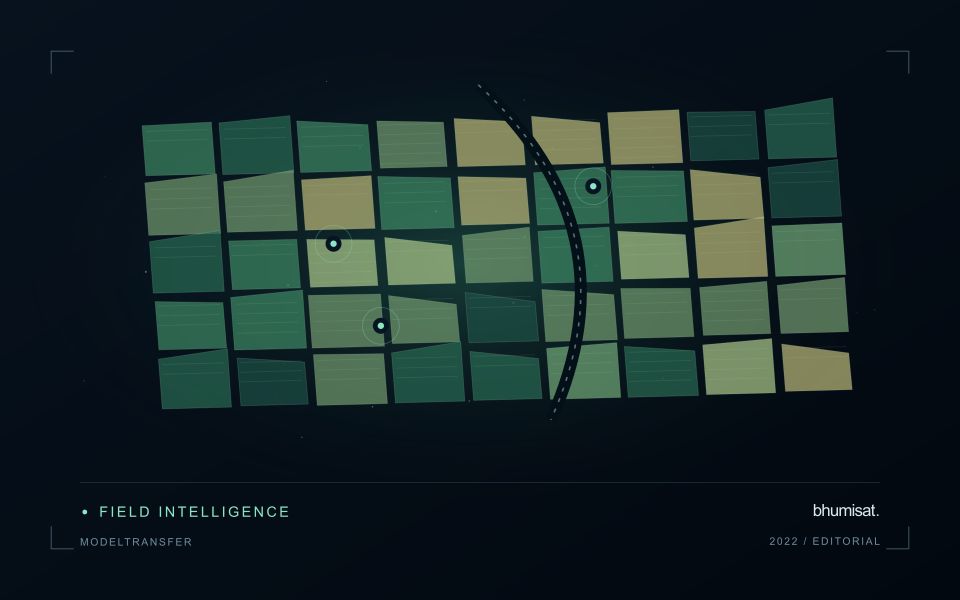
Comparisons through time are valuable only when the observations are sufficiently comparable for the question being asked. A difference between dates can reflect real change, a normal stage in a seasonal cycle, or a difference in how the surface was observed. This perspective examines the reference period, the timing of acquisitions, and the contextual records needed to interpret a sequence. It encourages the use of appropriate baselines rather than treating every previous observation as an equivalent benchmark. The objective is to identify changes that remain meaningful after normal variation and measurement conditions are considered.
This working guide considers viewing geometry and brdf effects across sediment-runoff catchments. The immediate decision is to connect sampling priorities across land and water. Useful reference evidence includes timed water samples, runoff context and land-cover observations. The case is an illustrative planning context, with assumptions to check against the actual sensor, landscape and project requirements.
The setting: Sediment-runoff catchments
A catchment monitoring project connects land-cover patterns, drainage pathways and observations of receiving waters. These evidence streams operate at different spatial and temporal scales. A bare land patch or a bright water plume may be relevant to a sampling question, but an image alone does not establish that one caused the other. Define whether the task is mapping potential source areas, tracking a visible water pattern or evaluating a particular sediment-related variable.
Maintain suitable land and water masks and compare acquisitions with their rainfall and flow context where that information is available. Clouds can obscure the period of greatest interest, and conditions may change rapidly after runoff events. Land adjacency, shallow water and surface reflections can also affect optical interpretation. A useful monitoring record identifies the dates and valid areas supporting each observation instead of presenting a continuous causal story across missing measurements.
Field validation should collect water measurements with clear location, timing and sampling methods, alongside the evidence used to describe land conditions. Sampling only the most obvious plume may overlook other parts of the response or ordinary background variation. More specific source attribution needs an investigation designed for that claim. A practical first product can organise catchment observations and prioritise coordinated sampling, while keeping remotely observed associations distinct from explanations established through additional measurements.
The observed surface has a direction-dependent response
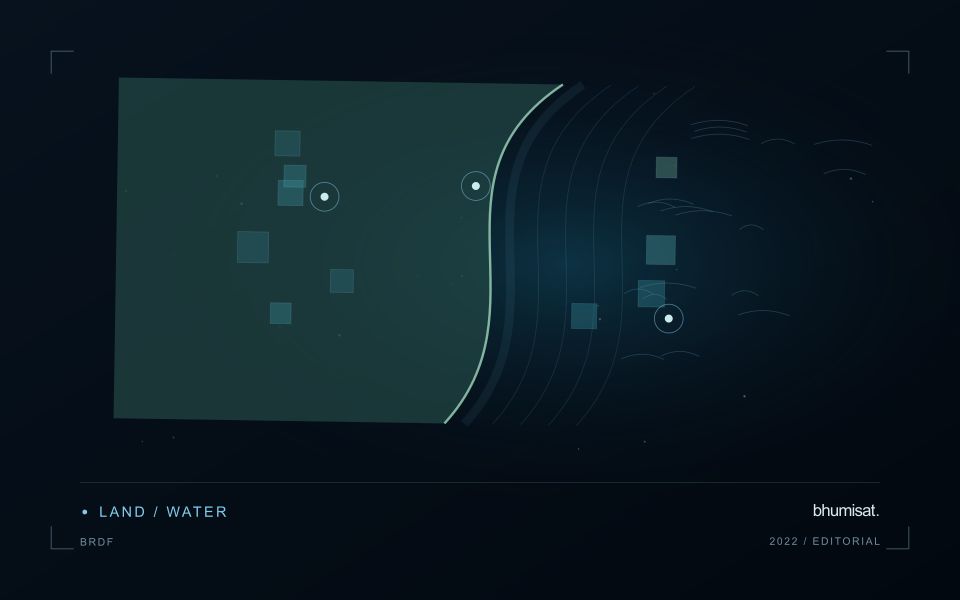
A surface does not necessarily reflect incoming light equally in every direction. Its measured brightness can change as the positions of the Sun, surface and sensor change, even when the surface itself is similar. The bidirectional reflectance distribution function provides a framework for describing this directional behaviour. In practical image analysis, the relevant lesson is that a difference between observations may contain a geometry effect as well as a real surface change. Canopy structure, shadows and surface roughness can all influence that relationship.
The magnitude and pattern of a geometry effect depend on the landscape and spectral measurement. A row crop, closed forest and exposed soil need not behave in the same way. Terrain introduces another layer because slope and aspect alter local illumination. A simple brightness adjustment is not automatically an adequate solution. A workflow should first identify the type of comparison it needs and whether the available product already includes a relevant normalisation. Applying an additional correction without understanding prior processing can create a new inconsistency.
Normalise geometry with a clear purpose
Geometry normalisation uses a model or adjustment to express observations under a more consistent reference condition. It is an approximation designed for a defined purpose, and its performance should be checked rather than assumed. Keep the input geometry, model assumptions and processing version where they are available. Compare representative surfaces before and after the adjustment. A useful test examines whether the correction reduces systematic variation in stable areas while preserving changes that are supported independently by management records or field observations.
For an agricultural service, the importance of this effect depends on the size of the change being interpreted. A subtle trend can be more sensitive to residual geometry variation than a major harvest event. Evaluate whether an apparent improvement in a time series survives across seasons and fields, including those with different canopy arrangements. Retain a clear explanation of what has been normalised and what remains uncertain. Viewing geometry becomes manageable when it is treated as part of the measurement context instead of being attributed silently to crop condition or land-cover change.
Keep an auditable review record
A review record should explain how a result moved from an analytical output to an accepted interpretation or operational decision. Preserve the product identifier, the evidence considered, the reviewer role, and the outcome of the review. A short, consistent record is often more useful than an extensive free-text note that cannot be compared between cases. The objective is to make important decisions traceable without turning routine review into unnecessary administrative work.
Separate observations from conclusions within the record. Describe the evidence visible to the reviewer, the alternative explanations considered where relevant, and the reason for accepting, qualifying, or rejecting the result. If a correction is required, identify what should change and how the revised product relates to the earlier version. Keep unresolved questions visible so that they can be addressed by another observation or by the person responsible for the next action.
Use the accumulated record to improve the workflow. Recurring review reasons can reveal unclear requirements, missing contextual information, unstable processing steps, or an evaluation gap. Examine whether similar cases receive similar decisions across reviewers and over time. Preserve the relationship between feedback and subsequent revisions so that improvements can be assessed against the evidence that motivated them. An auditable record supports learning, accountability, and consistent delivery while allowing the technical process to evolve.
Translate the decision into observation requirements
Start with the decision that the information is intended to support. Describe the geographic unit, the time available for acting, and the consequence of an incorrect interpretation. A requirement such as detecting an unusual pattern across management blocks is different from identifying its cause. Keeping that distinction explicit helps a team select measurements that are relevant to the application and prevents later evaluation from drifting towards whatever result happens to be easiest to demonstrate.
Build a compact requirements matrix linking each decision to the evidence needed, the proposed observation source, and an acceptance condition. Include geographic accuracy, temporal relevance, quality screening, and the context required for interpretation. The matrix should also identify the evidence used to justify each requirement. An engineering preference or a convenient data source can inform a study, but neither should silently replace a documented information need.
Review the matrix with the people who will use the result. Ask how their response would change when information is delayed, incomplete, or uncertain. Record unresolved requirements as questions for a pilot rather than converting them into confident specifications. This produces a practical framework for comparing technical options, designing tests, and explaining why an observation is useful to the intended workflow.
Bring the evidence back to the decision
A useful comparison preserves the dates, quality conditions, and contextual assumptions behind its baseline. Review unusual results against the actual observation sequence rather than relying entirely on a summary statistic. Where seasonal timing is important, describe how comparable stages were identified. The resulting analysis should help users distinguish an informative change from an expected cycle or an observation artefact, while making gaps and remaining uncertainty visible enough to guide further investigation.
Sources & further reading
Explore the bhumisat spacecraft concept and our vision towards 2030, or return to the journal.