An analytical result becomes operational information only when the receiving team can understand it and use it within existing responsibilities. Handoffs often fail because assumptions that were obvious to the analyst are absent from the delivered product. This perspective considers the information needed at that boundary: acquisition time, processing status, geographic scope, quality qualifications, and the action expected from the recipient. It also asks how corrections and feedback should return to the producing team. A dependable handoff creates a shared understanding of the result, rather than merely transferring a file.
This working guide considers viewing geometry and brdf effects across managed grazing pastures. The immediate decision is to schedule paddock condition inspections. Useful reference evidence includes grazing history, vegetation cover and field biomass samples. The case is an illustrative planning context, with assumptions to check against the actual sensor, landscape and project requirements.
The setting: Managed grazing pastures
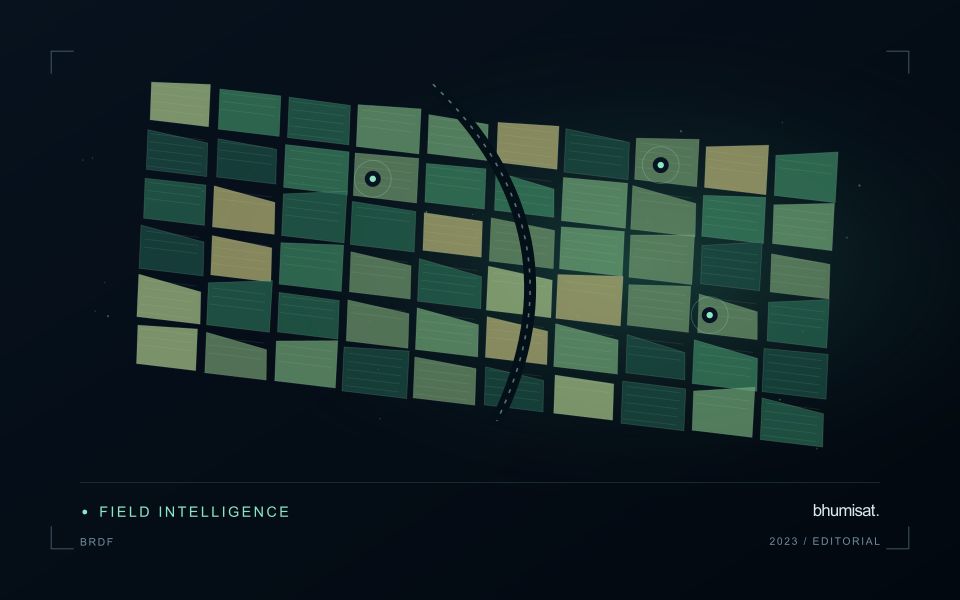
A managed pasture changes with grazing, recovery, mowing, rainfall and the mixture of vegetation present. A recently grazed paddock may show a lower vegetation response than a rested paddock without indicating a management failure. Interpret the image sequence with the paddock calendar and the intended operational question. The relevant product could describe vegetation cover, compare recovery patterns or help select locations for a field assessment of forage availability.
Paddock boundaries should separate the vegetation of interest from tracks, water points, tree cover and other surfaces where possible. These features can occupy a meaningful portion of small units. Repeated observations need quality screening and an explicit treatment of periods without suitable imagery. A green appearance alone does not establish forage quality, accessible biomass or the amount animals can use, so avoid substituting an index map for the measurements needed by a grazing decision.
Field validation should record recent grazing and management together with vegetation condition at known sampling locations. If biomass is estimated, use representative field samples with a clearly defined measurement method and spatial support. Include different recovery stages and ordinary paddock conditions in evaluation rather than only the most obvious extremes. A practical reporting system connects each mapped pattern to its observation date, management context and the field checks needed before changing an operational plan.
The observed surface has a direction-dependent response
A surface does not necessarily reflect incoming light equally in every direction. Its measured brightness can change as the positions of the Sun, surface and sensor change, even when the surface itself is similar. The bidirectional reflectance distribution function provides a framework for describing this directional behaviour. In practical image analysis, the relevant lesson is that a difference between observations may contain a geometry effect as well as a real surface change. Canopy structure, shadows and surface roughness can all influence that relationship.
The magnitude and pattern of a geometry effect depend on the landscape and spectral measurement. A row crop, closed forest and exposed soil need not behave in the same way. Terrain introduces another layer because slope and aspect alter local illumination. A simple brightness adjustment is not automatically an adequate solution. A workflow should first identify the type of comparison it needs and whether the available product already includes a relevant normalisation. Applying an additional correction without understanding prior processing can create a new inconsistency.
Normalise geometry with a clear purpose
Geometry normalisation uses a model or adjustment to express observations under a more consistent reference condition. It is an approximation designed for a defined purpose, and its performance should be checked rather than assumed. Keep the input geometry, model assumptions and processing version where they are available. Compare representative surfaces before and after the adjustment. A useful test examines whether the correction reduces systematic variation in stable areas while preserving changes that are supported independently by management records or field observations.
For an agricultural service, the importance of this effect depends on the size of the change being interpreted. A subtle trend can be more sensitive to residual geometry variation than a major harvest event. Evaluate whether an apparent improvement in a time series survives across seasons and fields, including those with different canopy arrangements. Retain a clear explanation of what has been normalised and what remains uncertain. Viewing geometry becomes manageable when it is treated as part of the measurement context instead of being attributed silently to crop condition or land-cover change.
Deliver quality flags that users can interpret
Quality information should describe the condition of an observation in terms that remain useful through the workflow. A single valid or invalid label may be sufficient for some calculations, but operational users often need to know why an observation was qualified. Distinguish acquisition limitations, processing failures, uncertain reference matches, and conditions that make interpretation ambiguous. These categories point towards different responses and should not be merged without a clear purpose.
Define a small, documented set of flags with stable meanings. Record whether a flag applies to a complete scene, a geographic unit, an individual measurement, or a derived result. A unit containing a mixture of qualified and unqualified observations may also require a coverage measure. Include the rule used to combine flags when summarising data so that a favourable average does not conceal a substantial fraction of unusable input.
Test the flags with the people receiving the product. Ask what they would do differently for each state and whether the terminology supports that choice. Keep the original flags available even if the interface presents a simpler summary. When flag definitions change, version the rules and review their effects on historical comparisons. Useful quality communication makes the condition of the evidence visible at the moment when a user decides how much confidence to place in the result.
Represent gaps without inventing observations
A monitoring sequence often contains periods without a usable observation. The reason may be cloud, shadow, missing coverage, a failed transfer, or a quality condition that excludes the data. Begin by representing these states explicitly. A missing observation is different from a low measurement, an unchanged surface, or a confirmed absence of the feature being studied. The distinction should survive both the analysis and the presentation of the result.
Define when a temporal gap is acceptable for the intended decision. A workflow may continue using the latest qualified observation, request another source, or suspend an alert until sufficient evidence is available. Whichever response is selected, show the age of the supporting observation. If interpolation is used for a suitable analytical purpose, preserve the distinction between an estimated value and a directly observed measurement, together with the assumptions needed to interpret it.
Review how gaps affect the coverage of the final evaluation. Locations with frequent missing data may differ systematically from those with regular observations. A performance estimate based only on clear, complete records can therefore describe a narrower population than the service is expected to support. Report usable coverage alongside analytical results and use recurring gaps to guide acquisition planning, reference collection, and the selection of complementary observation methods.
Bring the evidence back to the decision
A successful handoff leaves the recipient with a clear result, sufficient context, and a practical route for raising questions. Test the delivery with the people who will use it, including how they respond when observations are missing or qualified. Capture their feedback as evidence for improving the product. The most useful delivery format is the one that preserves the relevant technical meaning while fitting the decisions, time constraints, and responsibilities of its intended audience.
Sources & further reading
Explore the bhumisat spacecraft concept and our vision towards 2030, or return to the journal.