Comparisons through time are valuable only when the observations are sufficiently comparable for the question being asked. A difference between dates can reflect real change, a normal stage in a seasonal cycle, or a difference in how the surface was observed. This perspective examines the reference period, the timing of acquisitions, and the contextual records needed to interpret a sequence. It encourages the use of appropriate baselines rather than treating every previous observation as an equivalent benchmark. The objective is to identify changes that remain meaningful after normal variation and measurement conditions are considered.
This working guide considers atmospheric correction for comparable imagery along river water corridors. The immediate decision is to prioritise river reaches for sampling. Useful reference evidence includes sampling time, river stage and reach-specific water observations. The case is an illustrative planning context, with assumptions to check against the actual sensor, landscape and project requirements.
The setting: River water corridors
A river corridor can vary quickly in width, bank exposure, flow conditions and the surrounding land cover. A remotely observed reach may include water, sediment, vegetation and structures within the same footprint. Define the monitoring question before choosing an interpretation scale. Mapping the position of visible water, investigating a colour change and estimating a particular water-quality variable are different tasks, even where they draw on the same acquisition.
Spatial resolution and geometric alignment are critical for narrow reaches. A small offset can change how much bank or vegetation contributes to a measurement. Cloud, shadow, surface reflection and adjacency effects can further complicate optical interpretation. Compare suitable acquisitions and retain the exact dates supporting each reach summary. Where river conditions change rapidly, consider whether the available observation frequency is sufficient for the decision the service is intended to support.
Field sampling should identify the sampled reach, location and collection time, together with river conditions that affect comparability. A single bank-side sample may not describe the full width or a downstream reach observed at another time. A spectral anomaly can help select an investigation site without establishing its cause. More specific claims require a validated relationship with representative measurements, while a transparent water and reach inventory can already make a sampling programme more systematic.
Know which reflectance product is being compared
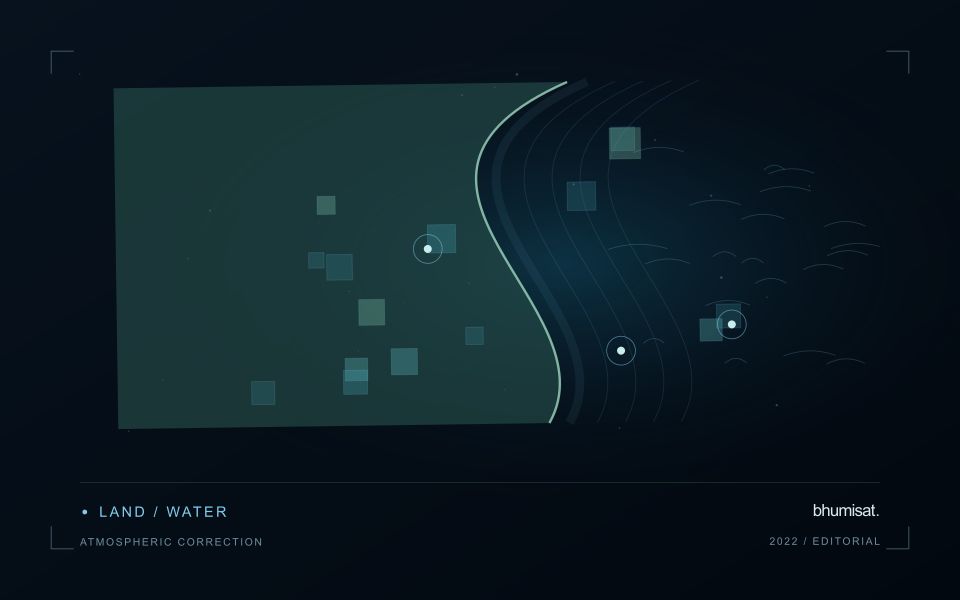
An optical satellite measures a signal that has interacted with both the surface and the atmosphere. Atmospheric correction estimates a surface-related reflectance quantity by accounting for relevant atmospheric contributions under a set of assumptions. This makes many comparisons more meaningful, especially across dates, but it does not turn every pixel into an exact ground measurement. The corrected product still carries uncertainty and may be unsuitable where clouds, strong haze, unusual illumination or difficult surface conditions violate the assumptions used by the processing method.
The processing level should match the analytical purpose. A visually useful image, a top-of-atmosphere reflectance product and a surface reflectance product can all represent the same acquisition while supporting different interpretations. Mixing these products inside one time series can create a discontinuity unrelated to the land. Record the product definition, processing version and quality information. Apply stored scale factors and offsets correctly before using numerical values in an index or model, and avoid assuming that all products from a named mission follow identical conventions.
Evaluate correction quality in the target landscape
A correction method should be examined in the landscape where its output will be used. Water, bright soil, complex terrain and vegetation can pose different challenges. Inspect the associated quality flags and review suspicious patterns against image context rather than accepting every corrected value automatically. Compare multiple dates and include stable reference areas when appropriate. A sudden change affecting many unrelated surfaces may indicate an acquisition or processing issue that deserves investigation before it is interpreted as an agricultural or environmental event.
A robust workflow treats correction quality and observation suitability as related but distinct decisions. Atmospheric correction does not remove clouds from the ground, and it does not resolve all effects of shadow, viewing geometry or surface mixing. Retain a policy for excluding unsuitable measurements and communicating gaps. If a processor update changes the historical record, assess the effect on derived statistics and alerts. The practical aim is a consistently defined observation series whose remaining limitations are understood, so that a user can evaluate a surface interpretation against the quality of its inputs.
Maintain the geographic units of analysis
Many observation services summarise measurements within a field, management block, catchment, forest unit, or other mapped boundary. The meaning of that summary depends on whether the boundary accurately represents the unit being discussed. Start with a clear source for the geometry and record its date, coordinate reference, and intended use. A boundary drawn for visual orientation may require additional checking before it becomes a measurement unit.
Inspect overlaps, gaps, narrow fragments, and features that may have changed since mapping. A geometrically valid polygon can still describe an outdated operational unit. Ask the responsible team how divisions, mergers, new infrastructure, and management changes are recorded. Where pixels or reference measurements cross a boundary, define how they are assigned or excluded so that results remain comparable between analysts and processing runs.
Version the boundaries alongside the observations. If a unit changes, preserve a relationship between the previous and revised geometry rather than replacing the history without explanation. Comparisons through time should identify whether they use a constant spatial unit or the operational units valid at each date. This makes it easier to distinguish a change in the measured surface from a change introduced by the geography used to summarise it.
Define a representative reference sample
A reference sample should represent the situations in which a method will be used. Begin by defining the target population: locations, time periods, management conditions, surface types, or instrument states that belong within the intended application. A collection of convenient observations may be valuable for exploration, but it does not automatically support conclusions about that wider population. Make the scope of the sample visible before calculating a summary of performance.
Consider a stratified design when important conditions are unevenly represented. Relevant strata might include different landscape types, developmental stages, observation quality levels, or ranges of the variable being estimated. Choose sample locations within those groups using a documented rule, and retain the information needed to understand their selection. Where access restrictions affect the sample, record the excluded conditions so that the limits of the resulting evaluation remain clear.
Keep development and evaluation evidence separate where the purpose of the study requires an independent test. Nearby observations or repeated measurements can share information, so a random split of individual records may overstate independence. A split organised by location, period, or operational unit can provide a more demanding comparison. The appropriate design follows the intended deployment, the structure of the observations, and the errors that matter to the user.
Bring the evidence back to the decision
A useful comparison preserves the dates, quality conditions, and contextual assumptions behind its baseline. Review unusual results against the actual observation sequence rather than relying entirely on a summary statistic. Where seasonal timing is important, describe how comparable stages were identified. The resulting analysis should help users distinguish an informative change from an expected cycle or an observation artefact, while making gaps and remaining uncertainty visible enough to guide further investigation.
Sources & further reading
Explore the bhumisat spacecraft concept and our vision towards 2030, or return to the journal.