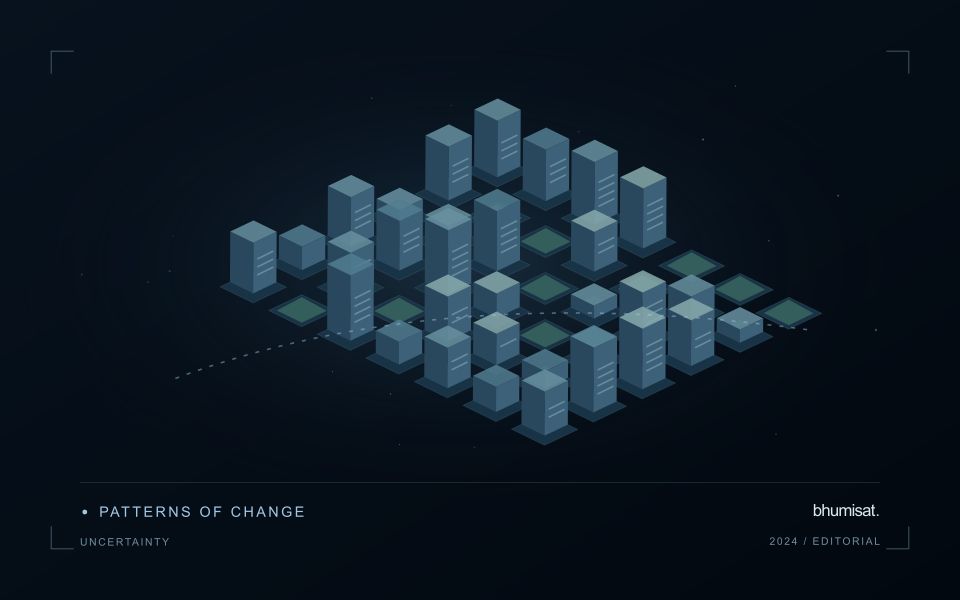
Comparisons through time are valuable only when the observations are sufficiently comparable for the question being asked. A difference between dates can reflect real change, a normal stage in a seasonal cycle, or a difference in how the surface was observed. This perspective examines the reference period, the timing of acquisitions, and the contextual records needed to interpret a sequence. It encourages the use of appropriate baselines rather than treating every previous observation as an equivalent benchmark. The objective is to identify changes that remain meaningful after normal variation and measurement conditions are considered.
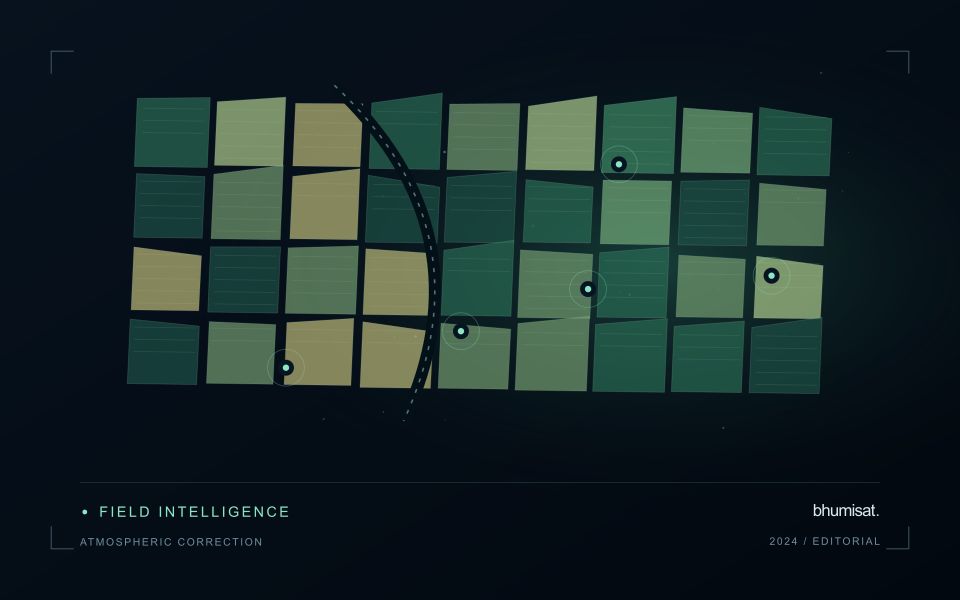
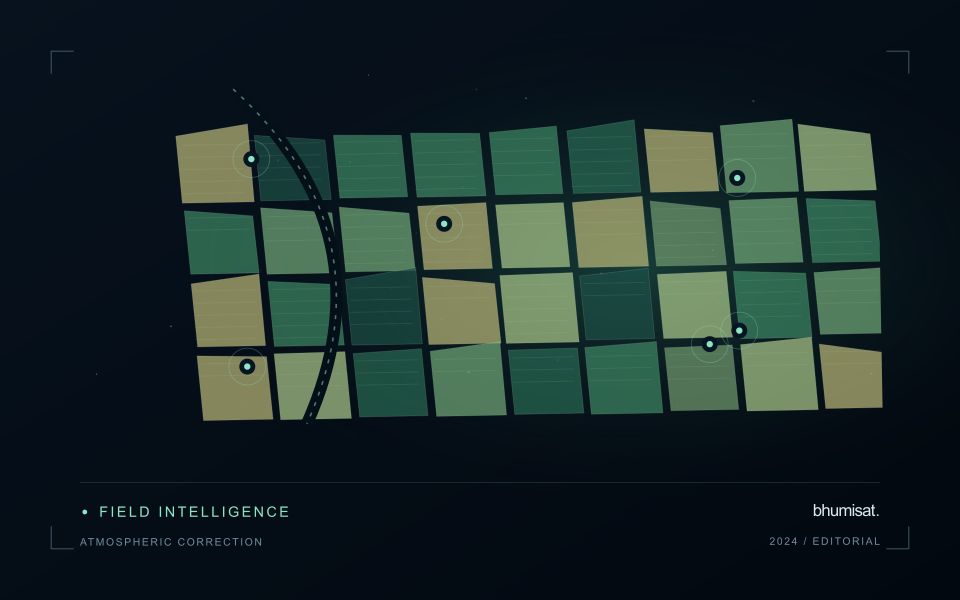
This working guide considers atmospheric correction for comparable imagery in rainfed rice landscapes. The immediate decision is to focus visits after uneven rainfall. Useful reference evidence includes planting dates, field moisture observations and crop stage. The case is an illustrative planning context, with assumptions to check against the actual sensor, landscape and project requirements.
Know which reflectance product is being compared
An optical satellite measures a signal that has interacted with both the surface and the atmosphere. Atmospheric correction estimates a surface-related reflectance quantity by accounting for relevant atmospheric contributions under a set of assumptions. This makes many comparisons more meaningful, especially across dates, but it does not turn every pixel into an exact ground measurement. The corrected product still carries uncertainty and may be unsuitable where clouds, strong haze, unusual illumination or difficult surface conditions violate the assumptions used by the processing method.
The processing level should match the analytical purpose. A visually useful image, a top-of-atmosphere reflectance product and a surface reflectance product can all represent the same acquisition while supporting different interpretations. Mixing these products inside one time series can create a discontinuity unrelated to the land. Record the product definition, processing version and quality information. Apply stored scale factors and offsets correctly before using numerical values in an index or model, and avoid assuming that all products from a named mission follow identical conventions.
Evaluate correction quality in the target landscape
A correction method should be examined in the landscape where its output will be used. Water, bright soil, complex terrain and vegetation can pose different challenges. Inspect the associated quality flags and review suspicious patterns against image context rather than accepting every corrected value automatically. Compare multiple dates and include stable reference areas when appropriate. A sudden change affecting many unrelated surfaces may indicate an acquisition or processing issue that deserves investigation before it is interpreted as an agricultural or environmental event.
A robust workflow treats correction quality and observation suitability as related but distinct decisions. Atmospheric correction does not remove clouds from the ground, and it does not resolve all effects of shadow, viewing geometry or surface mixing. Retain a policy for excluding unsuitable measurements and communicating gaps. If a processor update changes the historical record, assess the effect on derived statistics and alerts. The practical aim is a consistently defined observation series whose remaining limitations are understood, so that a user can evaluate a surface interpretation against the quality of its inputs.
The setting: Rainfed rice landscapes
Rainfed rice fields often follow planting calendars shaped by local rainfall, water retention and household decisions. Nearby fields may begin their crop cycles at different times, and some areas may remain unplanted during a reporting period. A monitoring system needs to separate these timing differences from potentially unusual crop development. Start with field boundaries and a record of whether a crop was actually established, together with the best available estimate of its establishment date.
Interpreting an image sequence requires attention to both vegetation and the recent water context. Soil background, temporary standing water and incomplete canopy cover can strongly influence early observations. Rainfall information can help describe the season, but it should not be treated as a direct measurement of water available to every field. Differences in drainage, soil properties and topographic position can create contrasting conditions within a short distance.
Use the analysis to select field questions that can be checked, such as delayed establishment or uneven canopy development. Record crop stage, recent management, visible water conditions and the circumstances that affected planting. Where production estimates are proposed, connect them to representative harvest observations rather than relying on an index threshold. Results should show observation dates and missing periods so that users can judge how current the evidence is before arranging an inspection.
Maintain the geographic units of analysis
Many observation services summarise measurements within a field, management block, catchment, forest unit, or other mapped boundary. The meaning of that summary depends on whether the boundary accurately represents the unit being discussed. Start with a clear source for the geometry and record its date, coordinate reference, and intended use. A boundary drawn for visual orientation may require additional checking before it becomes a measurement unit.
Inspect overlaps, gaps, narrow fragments, and features that may have changed since mapping. A geometrically valid polygon can still describe an outdated operational unit. Ask the responsible team how divisions, mergers, new infrastructure, and management changes are recorded. Where pixels or reference measurements cross a boundary, define how they are assigned or excluded so that results remain comparable between analysts and processing runs.
Version the boundaries alongside the observations. If a unit changes, preserve a relationship between the previous and revised geometry rather than replacing the history without explanation. Comparisons through time should identify whether they use a constant spatial unit or the operational units valid at each date. This makes it easier to distinguish a change in the measured surface from a change introduced by the geography used to summarise it.
Prioritise alerts using evidence and consequence
An alert is a request for attention, so its design should consider both the evidence available and the cost of responding. Begin by distinguishing a measured change, a proposed interpretation, and the action expected from the recipient. A large numerical difference is not automatically the most urgent case. The significance of the location, the age of the observation, the confidence in the interpretation, and the consequences of delay can all influence priority.
Create a review queue with enough context to support consistent decisions. Useful information can include the supporting dates, quality qualifications, previous observations, geographic unit, and the reason the case entered the queue. Define when an alert can be closed, escalated, or held for another observation. A documented rule is easier to improve than an informal practice that depends entirely on the memory of the operator reviewing the result.
Collect feedback from inspections and operational responses. Record alerts that led to a useful finding, alerts that required no action, and important conditions that the system failed to flag. Review these outcomes across different settings rather than relying only on a total count of alerts. The objective is a queue that directs limited attention towards meaningful decisions, while generating evidence for adjusting thresholds, improving context, and reducing repeated sources of unnecessary work.
Bring the evidence back to the decision
A useful comparison preserves the dates, quality conditions, and contextual assumptions behind its baseline. Review unusual results against the actual observation sequence rather than relying entirely on a summary statistic. Where seasonal timing is important, describe how comparable stages were identified. The resulting analysis should help users distinguish an informative change from an expected cycle or an observation artefact, while making gaps and remaining uncertainty visible enough to guide further investigation.
Sources & further reading
Explore the bhumisat spacecraft concept and our vision towards 2030, or return to the journal.