Remote observations show patterns, while practical decisions depend on explaining what those patterns could mean. Interpretation therefore requires more than locating a high or low value on a map. A useful analysis considers the timing of the observation, the physical processes that influence the measurement, and the information available from complementary sources. This perspective separates an observed signal from a proposed explanation and from an action recommended to a user. Keeping those stages distinct makes it easier to investigate alternative causes, communicate ambiguity, and choose a proportionate next step.
This working guide considers atmospheric correction for comparable imagery around aquaculture pond clusters. The immediate decision is to prioritise pond-cluster monitoring visits. Useful reference evidence includes pond boundaries, operation status and timed water measurements. The case is an illustrative planning context, with assumptions to check against the actual sensor, landscape and project requirements.
The setting: Aquaculture pond clusters
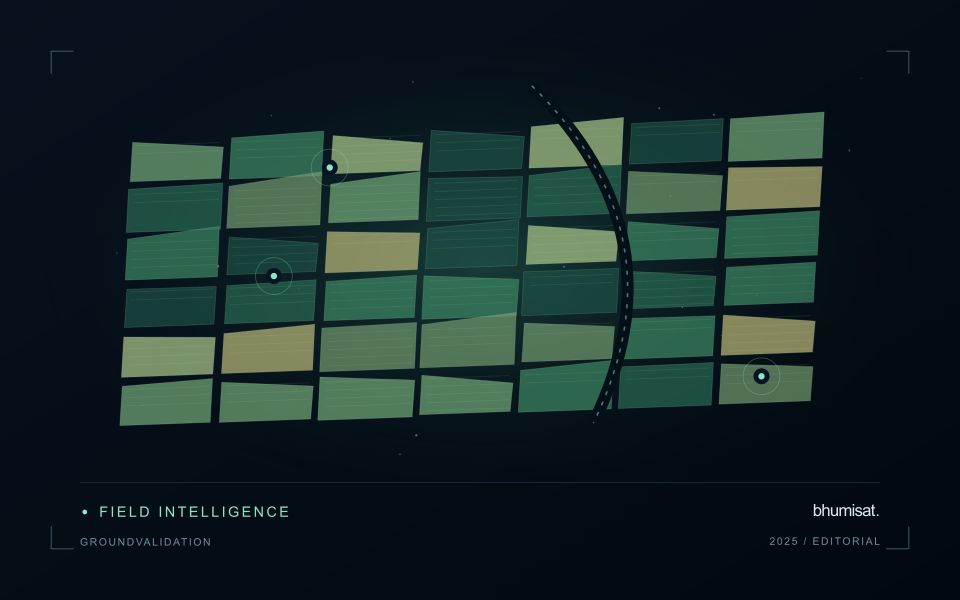
An aquaculture landscape contains ponds at different operating stages together with embankments, channels, roads and service areas. A satellite observation may support a pond inventory or a broader review of visible water patterns, but it should not be assumed to measure conditions within every individual production unit. Begin with boundaries and a record of pond status. Empty, recently filled and active ponds can have different appearances for ordinary operational reasons.
The size of a pond relative to the observation footprint determines how much embankment or neighbouring water contributes to a measurement. Review alignment and exclude unsuitable mixed areas where necessary. Surface reflections, cloud and atmospheric conditions can complicate optical comparison, while short-term management changes may occur between usable acquisitions. Retain observation dates and quality masks so that the image record does not imply continuous knowledge of rapidly changing pond conditions.
Validation should record the unit, collection time, operational context and the measurement method for any water variable being studied. A sample from one pond cannot automatically validate an adjacent pond or an entire cluster. A colour anomaly may help select a monitoring visit without establishing a particular biological condition or production outcome. More specific estimates require a demonstrated relationship with representative measurements, while inventory and inspection-priority products can be evaluated against the practical decisions they support.
Know which reflectance product is being compared
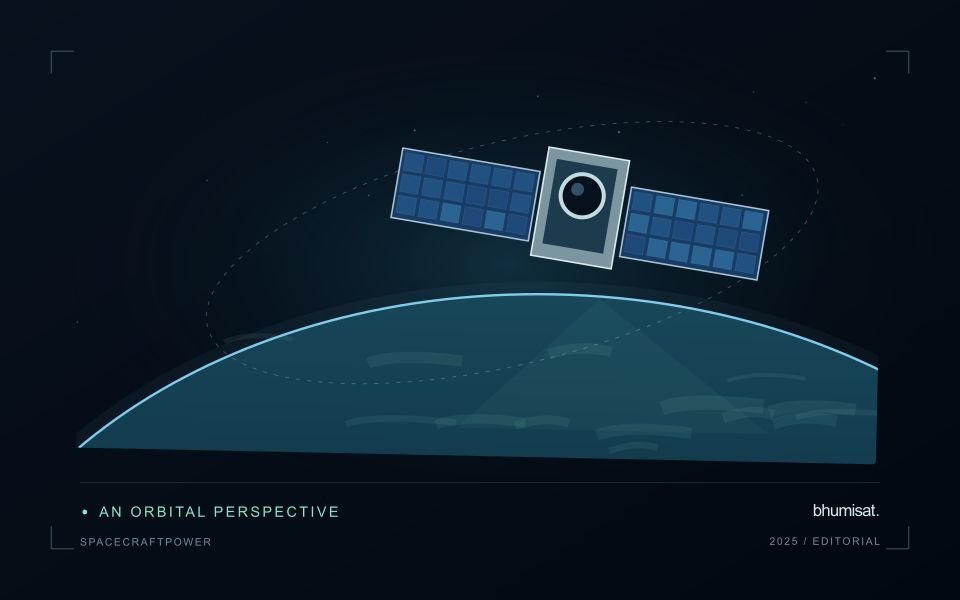
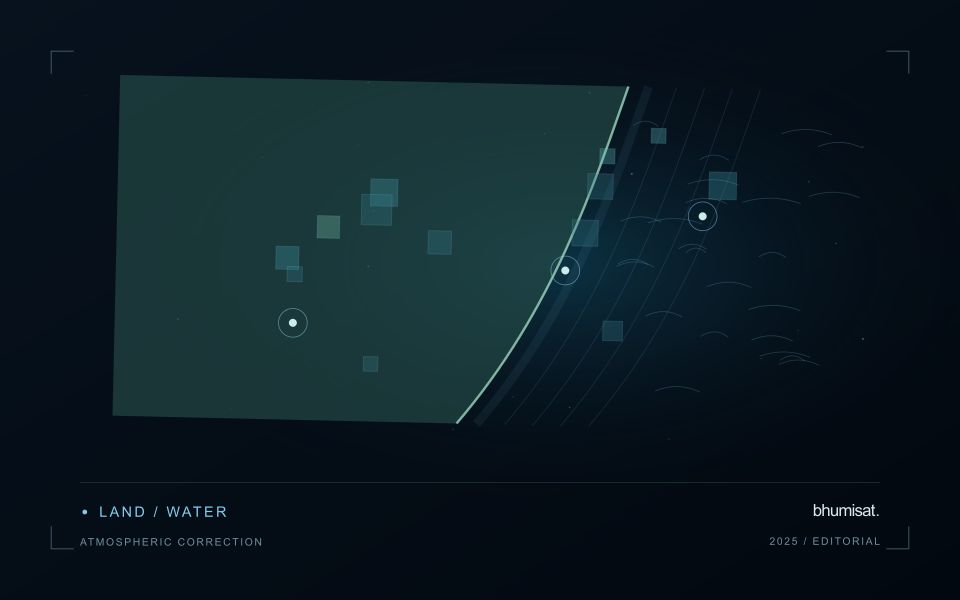
An optical satellite measures a signal that has interacted with both the surface and the atmosphere. Atmospheric correction estimates a surface-related reflectance quantity by accounting for relevant atmospheric contributions under a set of assumptions. This makes many comparisons more meaningful, especially across dates, but it does not turn every pixel into an exact ground measurement. The corrected product still carries uncertainty and may be unsuitable where clouds, strong haze, unusual illumination or difficult surface conditions violate the assumptions used by the processing method.
The processing level should match the analytical purpose. A visually useful image, a top-of-atmosphere reflectance product and a surface reflectance product can all represent the same acquisition while supporting different interpretations. Mixing these products inside one time series can create a discontinuity unrelated to the land. Record the product definition, processing version and quality information. Apply stored scale factors and offsets correctly before using numerical values in an index or model, and avoid assuming that all products from a named mission follow identical conventions.
Evaluate correction quality in the target landscape
A correction method should be examined in the landscape where its output will be used. Water, bright soil, complex terrain and vegetation can pose different challenges. Inspect the associated quality flags and review suspicious patterns against image context rather than accepting every corrected value automatically. Compare multiple dates and include stable reference areas when appropriate. A sudden change affecting many unrelated surfaces may indicate an acquisition or processing issue that deserves investigation before it is interpreted as an agricultural or environmental event.
A robust workflow treats correction quality and observation suitability as related but distinct decisions. Atmospheric correction does not remove clouds from the ground, and it does not resolve all effects of shadow, viewing geometry or surface mixing. Retain a policy for excluding unsuitable measurements and communicating gaps. If a processor update changes the historical record, assess the effect on derived statistics and alerts. The practical aim is a consistently defined observation series whose remaining limitations are understood, so that a user can evaluate a surface interpretation against the quality of its inputs.
Match the timing of reference observations
The value of a reference measurement depends partly on how well its timing matches the observation being evaluated. A surface, crop, water body, or instrument state may change between the two measurements. Start by documenting the acquisition time of every source and the period over which the reference observation applies. Avoid treating a date entered during data upload as though it were necessarily the time when the measurement was collected.
Define an acceptable timing relationship for the application. A slowly changing structural feature may tolerate a broader comparison window than a rapidly changing surface condition. The window should be justified by the process being studied and by any available contextual records. If conditions change within that period, consider separating the observations into suitable groups rather than combining them under a single assumption of comparability.
Preserve information about interventions and events between observations. A management operation, rainfall episode, disturbance, or change in sensor configuration can alter the interpretation of a comparison. Record the event and decide whether the pair remains suitable for evaluation. Where the timing mismatch cannot be resolved, describe the comparison as qualified evidence. This is more informative than allowing an uncertain match to influence a performance statistic without explanation.
Connect observations within a catchment
Water-related observations often depend on processes beyond the immediate pixel or sampling location. Begin by identifying the geographic relationships that are relevant to the question: upstream areas, connected drainage paths, contributing land uses, and the receiving water body. A local pattern may be easier to interpret when placed within that wider setting. The catchment boundary is a useful organising unit, but its suitability should be checked against the process and observation scale.
Combine the remote observation with contextual records that can help explain its timing and spatial pattern. Rainfall, water level, land management, and known interventions can influence what is observed. Preserve the dates and geographic meaning of those records rather than treating them as timeless attributes. Where drainage connections are uncertain or change with conditions, state the limitation and consider whether additional mapping or reference observations would materially improve the interpretation.
Plan reference sampling across locations that distinguish plausible explanations. A set of measurements concentrated at an easily accessible outlet may provide a different view from one that also represents tributaries, source areas, and contrasting conditions. Document how each location contributes to the evaluation. Interpret spatial agreement with care, because connected observations can share influences and may not provide independent evidence. The resulting workflow should connect local measurements with a defensible account of the wider system they help describe.
Bring the evidence back to the decision
A strong interpretation states what was observed, which explanations remain plausible, and what additional evidence would help distinguish them. Avoid presenting a convenient label as a confirmed cause when the measurements support only a broader pattern. Connect the proposed next step to the significance of the decision and the confidence available. This creates an interpretation that a field team, analyst, or project partner can examine, challenge, and improve as further observations become available.
Sources & further reading
Explore the bhumisat spacecraft concept and our vision towards 2030, or return to the journal.